29
/pt/
pt
AIzaSyAYiBZKx7MnpbEhh9jyipgxe19OcubqV5w
April 1, 2024
25903
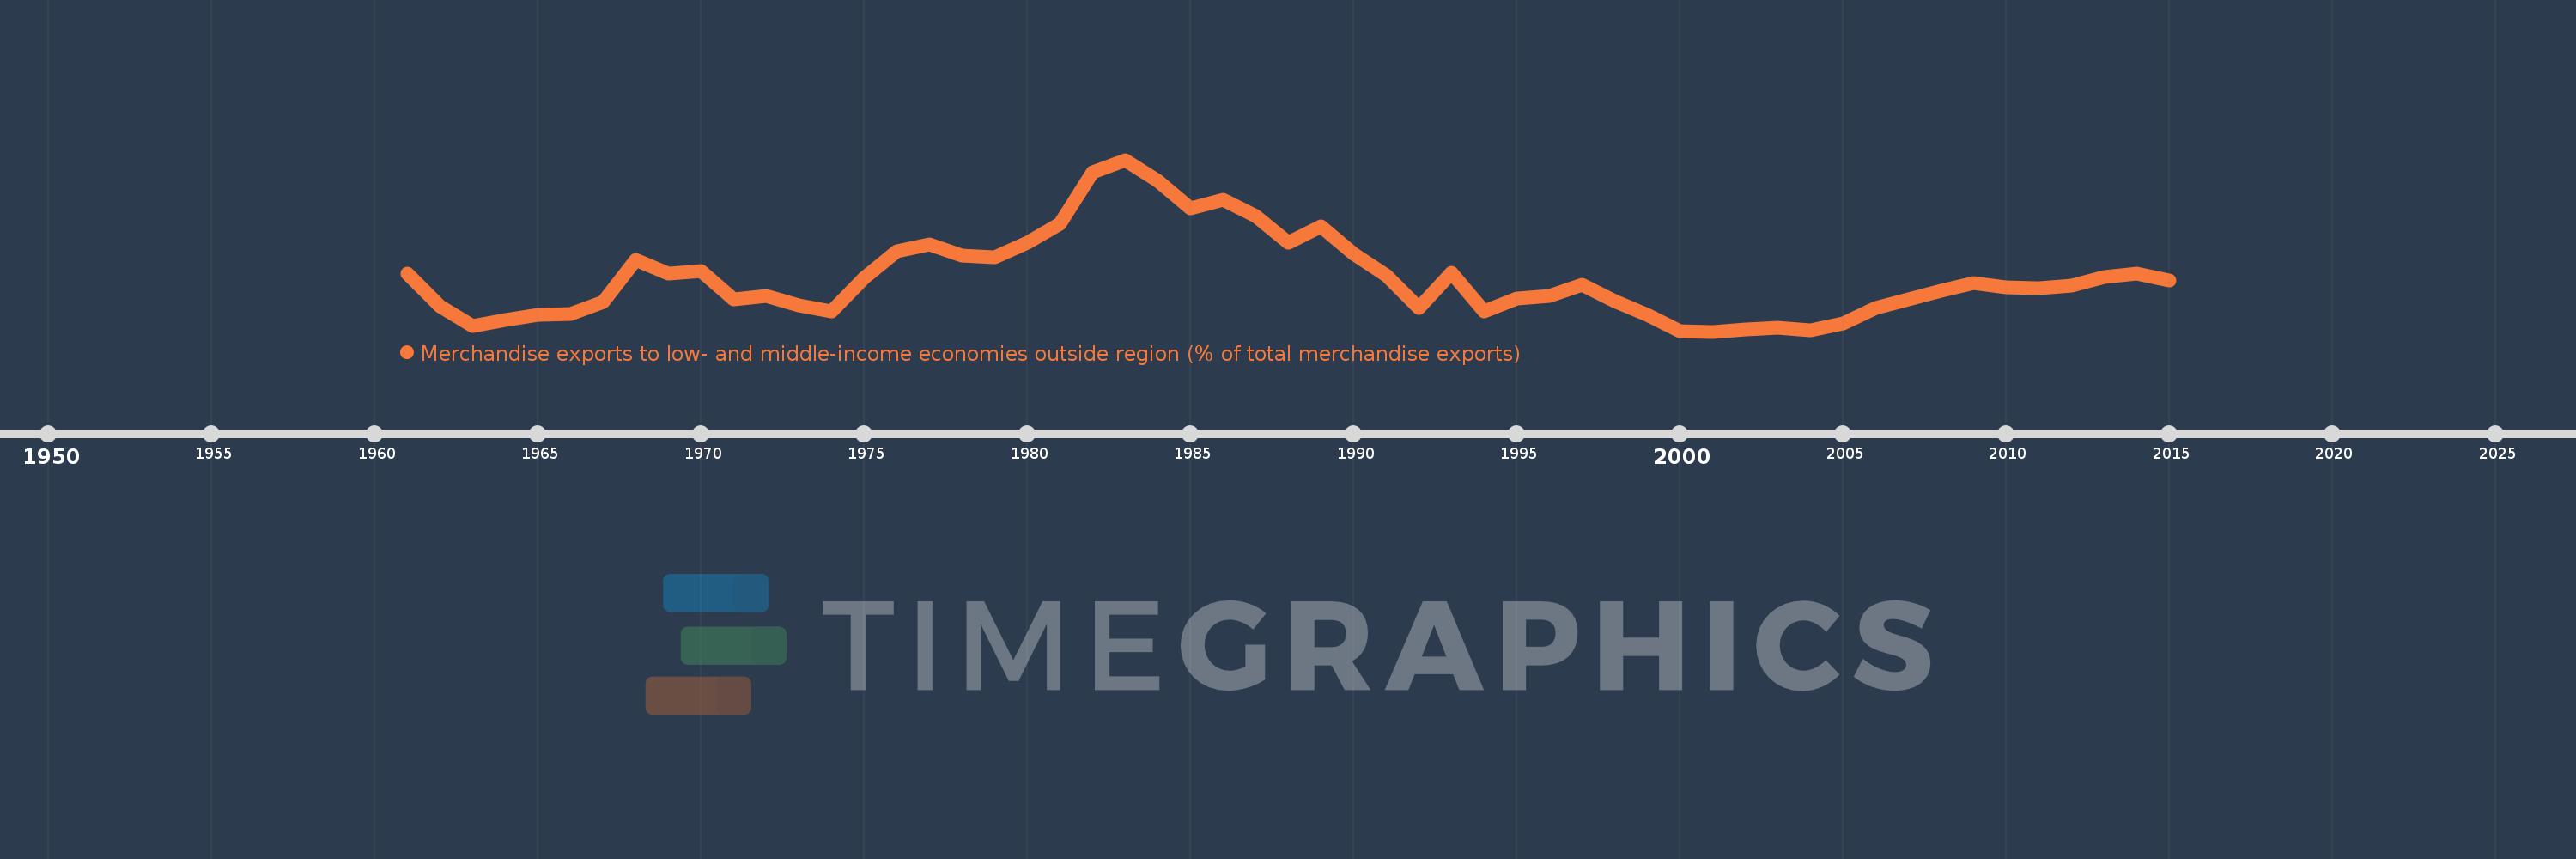
Central Europe and the Baltics
CEB
false
2
1
Merchandise exports to low- and middle-income economies outside region (% of total merchandise exports)
2015,2014,2013,2012,2011,2010,2009,2008,2007,2006,2005,2004,2003,2002,2001,2000,1999,1998,1997,1996,1995,1994,1993,1992,1991,1990,1989,1988,1987,1986,1985,1984,1983,1982,1981,1980,1979,1978,1977,1976,1975,1974,1973,1972,1971,1970,1969,1968,1967,1966,1965,1964,1963,1962,1961
Estas estatísticas em outros países:
AfghanistanAlbaniaAlgeriaAngolaArab WorldArgentinaArmeniaArubaAustraliaAustriaAzerbaijanBahamas, TheBahrainBangladeshBarbadosBelarusBelgiumBelizeBeninBermudaBoliviaBrazilBrunei DarussalamBulgariaBurundiCabo VerdeCambodiaCameroonCanadaCaribbean small statesCentral African RepublicCentral Europe and the BalticsChileChinaColombiaCongo, Dem. Rep.Congo, Rep.Costa RicaCote d'IvoireCroatiaCubaCyprusCzech RepublicDenmarkDominicaDominican RepublicEarly-demographic dividendEast Asia & PacificEast Asia & Pacific (excluding high income)East Asia & Pacific (IDA & IBRD countries)EcuadorEgypt, Arab Rep.El SalvadorEstoniaEthiopiaEuro areaEurope & Central AsiaEurope & Central Asia (excluding high income)Europe & Central Asia (IDA & IBRD countries)European UnionFijiFinlandFragile and conflict affected situationsFranceGabonGambia, TheGeorgiaGermanyGhanaGreeceGreenlandGuatemalaGuineaGuyanaHaitiHeavily indebted poor countries (HIPC)High incomeHondurasHong Kong SAR, ChinaHungaryIBRD onlyIcelandIDA & IBRD totalIDA blendIDA onlyIDA totalIndiaIndonesiaIran, Islamic Rep.IraqIrelandIsraelItalyJamaicaJapanJordanKazakhstanKenyaKorea, Dem. People’s Rep.Korea, Rep.KuwaitLao PDRLate-demographic dividendLatin America & Caribbean Latin America & Caribbean (excluding high income)Latin America & the Caribbean (IDA & IBRD countries)LatviaLeast developed countries: UN classificationLebanonLiberiaLibyaLithuaniaLow & middle incomeLow incomeLower middle incomeLuxembourgMacao SAR, ChinaMacedonia, FYRMadagascarMalawiMalaysiaMaliMaltaMauritaniaMauritiusMexicoMiddle East & North AfricaMiddle East & North Africa (excluding high income)Middle East & North Africa (IDA & IBRD countries)Middle incomeMoldovaMongoliaMontenegroMoroccoMozambiqueMyanmarNetherlandsNew CaledoniaNew ZealandNicaraguaNigerNigeriaNorth AmericaNorwayOECD membersOmanOther small statesPacific island small statesPakistanPanamaPapua New GuineaParaguayPeruPhilippinesPolandPortugalPost-demographic dividendPre-demographic dividendQatarRomaniaRussian FederationRwandaSamoaSaudi ArabiaSenegalSerbiaSeychellesSierra LeoneSingaporeSlovak RepublicSloveniaSmall statesSomaliaSouth AfricaSouth AsiaSouth Asia (IDA & IBRD)SpainSri LankaSt. LuciaSt. Vincent and the GrenadinesSub-Saharan Africa Sub-Saharan Africa (excluding high income)Sub-Saharan Africa (IDA & IBRD countries)SudanSurinameSwedenSwitzerlandSyrian Arab RepublicTanzaniaThailandTogoTrinidad and TobagoTunisiaTurkeyUgandaUkraineUnited Arab EmiratesUnited KingdomUnited StatesUpper middle incomeUruguayVenezuela, RBVietnamWorldYemen, Rep.ZambiaZimbabwe Linha do tempo:
Nesta escala de tempo está apresentado um gráfico de 1961 ano até 2015 ano Central Europe and the Baltics. Dados de 1960 ano ausente. O número de observações reais por data: 55.
Fonte (nome):
Indicadores de desenvolvimento mundial
Fonte (organização):
World Bank staff estimates based data from International Monetary Fund's Direction of Trade database.
Categorias:
Private Sector, Trade
Foi atualizado:
23 abr 2017 ano
Indicadores de alterações dos valores ao longo dos anos
Mínimo:
7.41
1 jan 2001 ano
Máximo:
21.167
1 jan 1983 ano
Na data de observação
Valor
Mudança absoluta
A alteração em relação ao valor anterior
1 jan 1961 ano
12.041
+12.041
0.0%
1 jan 1962 ano
9.453
-2.588
-21.49%
1 jan 1963 ano
7.823
-1.629
-17.24%
1 jan 1964 ano
8.351
+0.527
6.74%
1 jan 1965 ano
8.725
+0.375
4.49%
1 jan 1966 ano
8.797
+0.072
0.82%
1 jan 1967 ano
9.776
+0.979
11.12%
1 jan 1968 ano
13.165
+3.39
34.67%
1 jan 1969 ano
12.03
-1.135
-8.62%
1 jan 1970 ano
12.278
+0.248
2.06%
1 jan 1971 ano
9.984
-2.294
-18.68%
1 jan 1972 ano
10.238
+0.254
2.55%
1 jan 1973 ano
9.485
-0.753
-7.36%
1 jan 1974 ano
9.057
-0.428
-4.51%
1 jan 1975 ano
11.722
+2.666
29.43%
1 jan 1976 ano
13.841
+2.119
18.07%
1 jan 1977 ano
14.371
+0.53
3.83%
1 jan 1978 ano
13.486
-0.885
-6.16%
1 jan 1979 ano
13.355
-0.132
-0.98%
1 jan 1980 ano
14.528
+1.174
8.79%
1 jan 1981 ano
16.012
+1.484
10.21%
1 jan 1982 ano
20.18
+4.168
26.03%
1 jan 1983 ano
21.167
+0.987
4.89%
1 jan 1984 ano
19.487
-1.681
-7.94%
1 jan 1985 ano
17.307
-2.18
-11.19%
1 jan 1986 ano
17.95
+0.644
3.72%
1 jan 1987 ano
16.679
-1.272
-7.09%
1 jan 1988 ano
14.512
-2.166
-12.99%
1 jan 1989 ano
15.845
+1.333
9.19%
1 jan 1990 ano
13.62
-2.226
-14.05%
1 jan 1991 ano
11.948
-1.672
-12.28%
1 jan 1992 ano
9.307
-2.641
-22.1%
1 jan 1993 ano
12.096
+2.789
29.97%
1 jan 1994 ano
9.008
-3.088
-25.53%
1 jan 1995 ano
10.044
+1.036
11.5%
1 jan 1996 ano
10.275
+0.231
2.3%
1 jan 1997 ano
11.131
+0.856
8.33%
1 jan 1998 ano
9.859
-1.272
-11.42%
1 jan 1999 ano
8.719
-1.141
-11.57%
1 jan 2000 ano
7.411
-1.307
-15.0%
1 jan 2001 ano
7.41
-0.002
-0.02%
1 jan 2002 ano
7.568
+0.158
2.14%
1 jan 2003 ano
7.752
+0.184
2.43%
1 jan 2004 ano
7.52
-0.232
-3.0%
1 jan 2005 ano
8.057
+0.537
7.15%
1 jan 2006 ano
9.292
+1.235
15.33%
1 jan 2007 ano
9.999
+0.706
7.6%
1 jan 2008 ano
10.702
+0.703
7.03%
1 jan 2009 ano
11.316
+0.614
5.74%
1 jan 2010 ano
10.971
-0.346
-3.05%
1 jan 2011 ano
10.877
-0.093
-0.85%
1 jan 2012 ano
11.091
+0.213
1.96%
1 jan 2013 ano
11.785
+0.694
6.26%
1 jan 2014 ano
12.087
+0.303
2.57%
1 jan 2015 ano
11.49
-0.598
-4.95%
Classificação de países por estatísticas atuais por anos


Comentários: