29
/pt/
pt
AIzaSyAYiBZKx7MnpbEhh9jyipgxe19OcubqV5w
April 1, 2024
276896
United States
USA
true
2
1
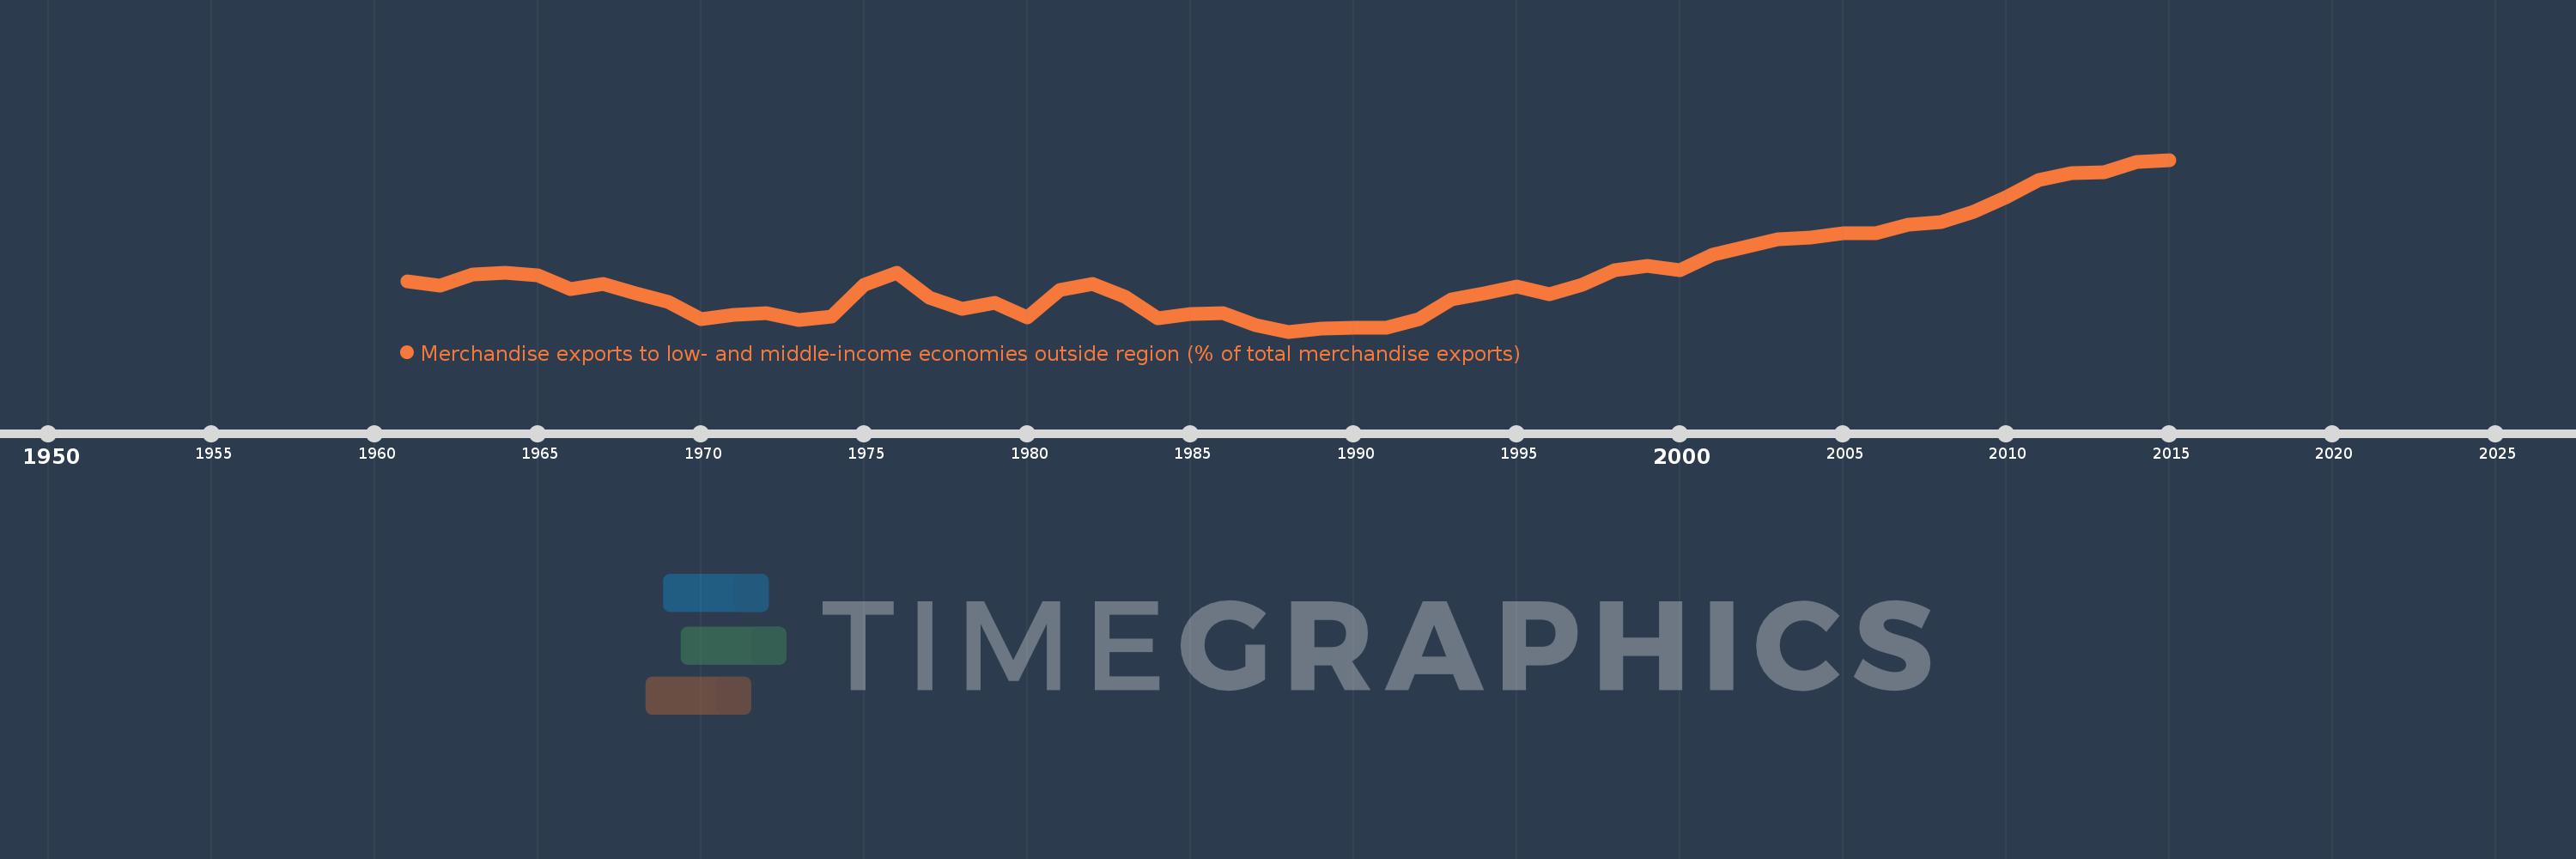
Merchandise exports to low- and middle-income economies outside region (% of total merchandise exports)
2015,2014,2013,2012,2011,2010,2009,2008,2007,2006,2005,2004,2003,2002,2001,2000,1999,1998,1997,1996,1995,1994,1993,1992,1991,1990,1989,1988,1987,1986,1985,1984,1983,1982,1981,1980,1979,1978,1977,1976,1975,1974,1973,1972,1971,1970,1969,1968,1967,1966,1965,1964,1963,1962,1961
Estas estatísticas em outros países:
AfghanistanAlbaniaAlgeriaAngolaArab WorldArgentinaArmeniaArubaAustraliaAustriaAzerbaijanBahamas, TheBahrainBangladeshBarbadosBelarusBelgiumBelizeBeninBermudaBoliviaBrazilBrunei DarussalamBulgariaBurundiCabo VerdeCambodiaCameroonCanadaCaribbean small statesCentral African RepublicCentral Europe and the BalticsChileChinaColombiaCongo, Dem. Rep.Congo, Rep.Costa RicaCote d'IvoireCroatiaCubaCyprusCzech RepublicDenmarkDominicaDominican RepublicEarly-demographic dividendEast Asia & PacificEast Asia & Pacific (excluding high income)East Asia & Pacific (IDA & IBRD countries)EcuadorEgypt, Arab Rep.El SalvadorEstoniaEthiopiaEuro areaEurope & Central AsiaEurope & Central Asia (excluding high income)Europe & Central Asia (IDA & IBRD countries)European UnionFijiFinlandFragile and conflict affected situationsFranceGabonGambia, TheGeorgiaGermanyGhanaGreeceGreenlandGuatemalaGuineaGuyanaHaitiHeavily indebted poor countries (HIPC)High incomeHondurasHong Kong SAR, ChinaHungaryIBRD onlyIcelandIDA & IBRD totalIDA blendIDA onlyIDA totalIndiaIndonesiaIran, Islamic Rep.IraqIrelandIsraelItalyJamaicaJapanJordanKazakhstanKenyaKorea, Dem. People’s Rep.Korea, Rep.KuwaitLao PDRLate-demographic dividendLatin America & Caribbean Latin America & Caribbean (excluding high income)Latin America & the Caribbean (IDA & IBRD countries)LatviaLeast developed countries: UN classificationLebanonLiberiaLibyaLithuaniaLow & middle incomeLow incomeLower middle incomeLuxembourgMacao SAR, ChinaMacedonia, FYRMadagascarMalawiMalaysiaMaliMaltaMauritaniaMauritiusMexicoMiddle East & North AfricaMiddle East & North Africa (excluding high income)Middle East & North Africa (IDA & IBRD countries)Middle incomeMoldovaMongoliaMontenegroMoroccoMozambiqueMyanmarNetherlandsNew CaledoniaNew ZealandNicaraguaNigerNigeriaNorth AmericaNorwayOECD membersOmanOther small statesPacific island small statesPakistanPanamaPapua New GuineaParaguayPeruPhilippinesPolandPortugalPost-demographic dividendPre-demographic dividendQatarRomaniaRussian FederationRwandaSamoaSaudi ArabiaSenegalSerbiaSeychellesSierra LeoneSingaporeSlovak RepublicSloveniaSmall statesSomaliaSouth AfricaSouth AsiaSouth Asia (IDA & IBRD)SpainSri LankaSt. LuciaSt. Vincent and the GrenadinesSub-Saharan Africa Sub-Saharan Africa (excluding high income)Sub-Saharan Africa (IDA & IBRD countries)SudanSurinameSwedenSwitzerlandSyrian Arab RepublicTanzaniaThailandTogoTrinidad and TobagoTunisiaTurkeyUgandaUkraineUnited Arab EmiratesUnited KingdomUnited StatesUpper middle incomeUruguayVenezuela, RBVietnamWorldYemen, Rep.ZambiaZimbabwe Linha do tempo:
Nesta escala de tempo está apresentado um gráfico de 1961 ano até 2015 ano United States. Dados de 1960 ano ausente. O número de observações reais por data: 55.
Fonte (nome):
Indicadores de desenvolvimento mundial
Fonte (organização):
World Bank staff estimates based data from International Monetary Fund's Direction of Trade database.
Categorias:
Private Sector, Trade
Foi atualizado:
23 abr 2017 ano
Indicadores de alterações dos valores ao longo dos anos
Mínimo:
18.997
1 jan 1988 ano
Máximo:
38.902
1 jan 2015 ano
Na data de observação
Valor
Mudança absoluta
A alteração em relação ao valor anterior
1 jan 1961 ano
24.786
+24.786
0.0%
1 jan 1962 ano
24.346
-0.439
-1.77%
1 jan 1963 ano
25.633
+1.286
5.28%
1 jan 1964 ano
25.842
+0.209
0.82%
1 jan 1965 ano
25.479
-0.363
-1.41%
1 jan 1966 ano
23.955
-1.523
-5.98%
1 jan 1967 ano
24.506
+0.55
2.3%
1 jan 1968 ano
23.393
-1.112
-4.54%
1 jan 1969 ano
22.46
-0.933
-3.99%
1 jan 1970 ano
20.393
-2.067
-9.2%
1 jan 1971 ano
20.904
+0.511
2.5%
1 jan 1972 ano
21.144
+0.241
1.15%
1 jan 1973 ano
20.364
-0.781
-3.69%
1 jan 1974 ano
20.749
+0.386
1.89%
1 jan 1975 ano
24.452
+3.702
17.84%
1 jan 1976 ano
25.856
+1.405
5.74%
1 jan 1977 ano
22.976
-2.88
-11.14%
1 jan 1978 ano
21.623
-1.354
-5.89%
1 jan 1979 ano
22.307
+0.684
3.16%
1 jan 1980 ano
20.685
-1.622
-7.27%
1 jan 1981 ano
23.813
+3.128
15.12%
1 jan 1982 ano
24.515
+0.702
2.95%
1 jan 1983 ano
22.994
-1.521
-6.21%
1 jan 1984 ano
20.567
-2.426
-10.55%
1 jan 1985 ano
21.011
+0.444
2.16%
1 jan 1986 ano
21.166
+0.155
0.74%
1 jan 1987 ano
19.737
-1.429
-6.75%
1 jan 1988 ano
18.997
-0.74
-3.75%
1 jan 1989 ano
19.327
+0.331
1.74%
1 jan 1990 ano
19.431
+0.103
0.54%
1 jan 1991 ano
19.48
+0.049
0.25%
1 jan 1992 ano
20.415
+0.935
4.8%
1 jan 1993 ano
22.688
+2.273
11.13%
1 jan 1994 ano
23.437
+0.749
3.3%
1 jan 1995 ano
24.243
+0.806
3.44%
1 jan 1996 ano
23.335
-0.908
-3.75%
1 jan 1997 ano
24.443
+1.108
4.75%
1 jan 1998 ano
26.117
+1.674
6.85%
1 jan 1999 ano
26.61
+0.493
1.89%
1 jan 2000 ano
26.116
-0.494
-1.86%
1 jan 2001 ano
27.934
+1.818
6.96%
1 jan 2002 ano
28.791
+0.858
3.07%
1 jan 2003 ano
29.679
+0.888
3.08%
1 jan 2004 ano
29.911
+0.233
0.78%
1 jan 2005 ano
30.345
+0.434
1.45%
1 jan 2006 ano
30.428
+0.083
0.27%
1 jan 2007 ano
31.398
+0.969
3.19%
1 jan 2008 ano
31.687
+0.289
0.92%
1 jan 2009 ano
32.919
+1.232
3.89%
1 jan 2010 ano
34.6
+1.681
5.11%
1 jan 2011 ano
36.521
+1.921
5.55%
1 jan 2012 ano
37.346
+0.825
2.26%
1 jan 2013 ano
37.422
+0.077
0.21%
1 jan 2014 ano
38.642
+1.22
3.26%
1 jan 2015 ano
38.902
+0.26
0.67%
Classificação de países por estatísticas atuais por anos


Comentários: