29
/pt/
pt
AIzaSyAYiBZKx7MnpbEhh9jyipgxe19OcubqV5w
April 1, 2024
35153
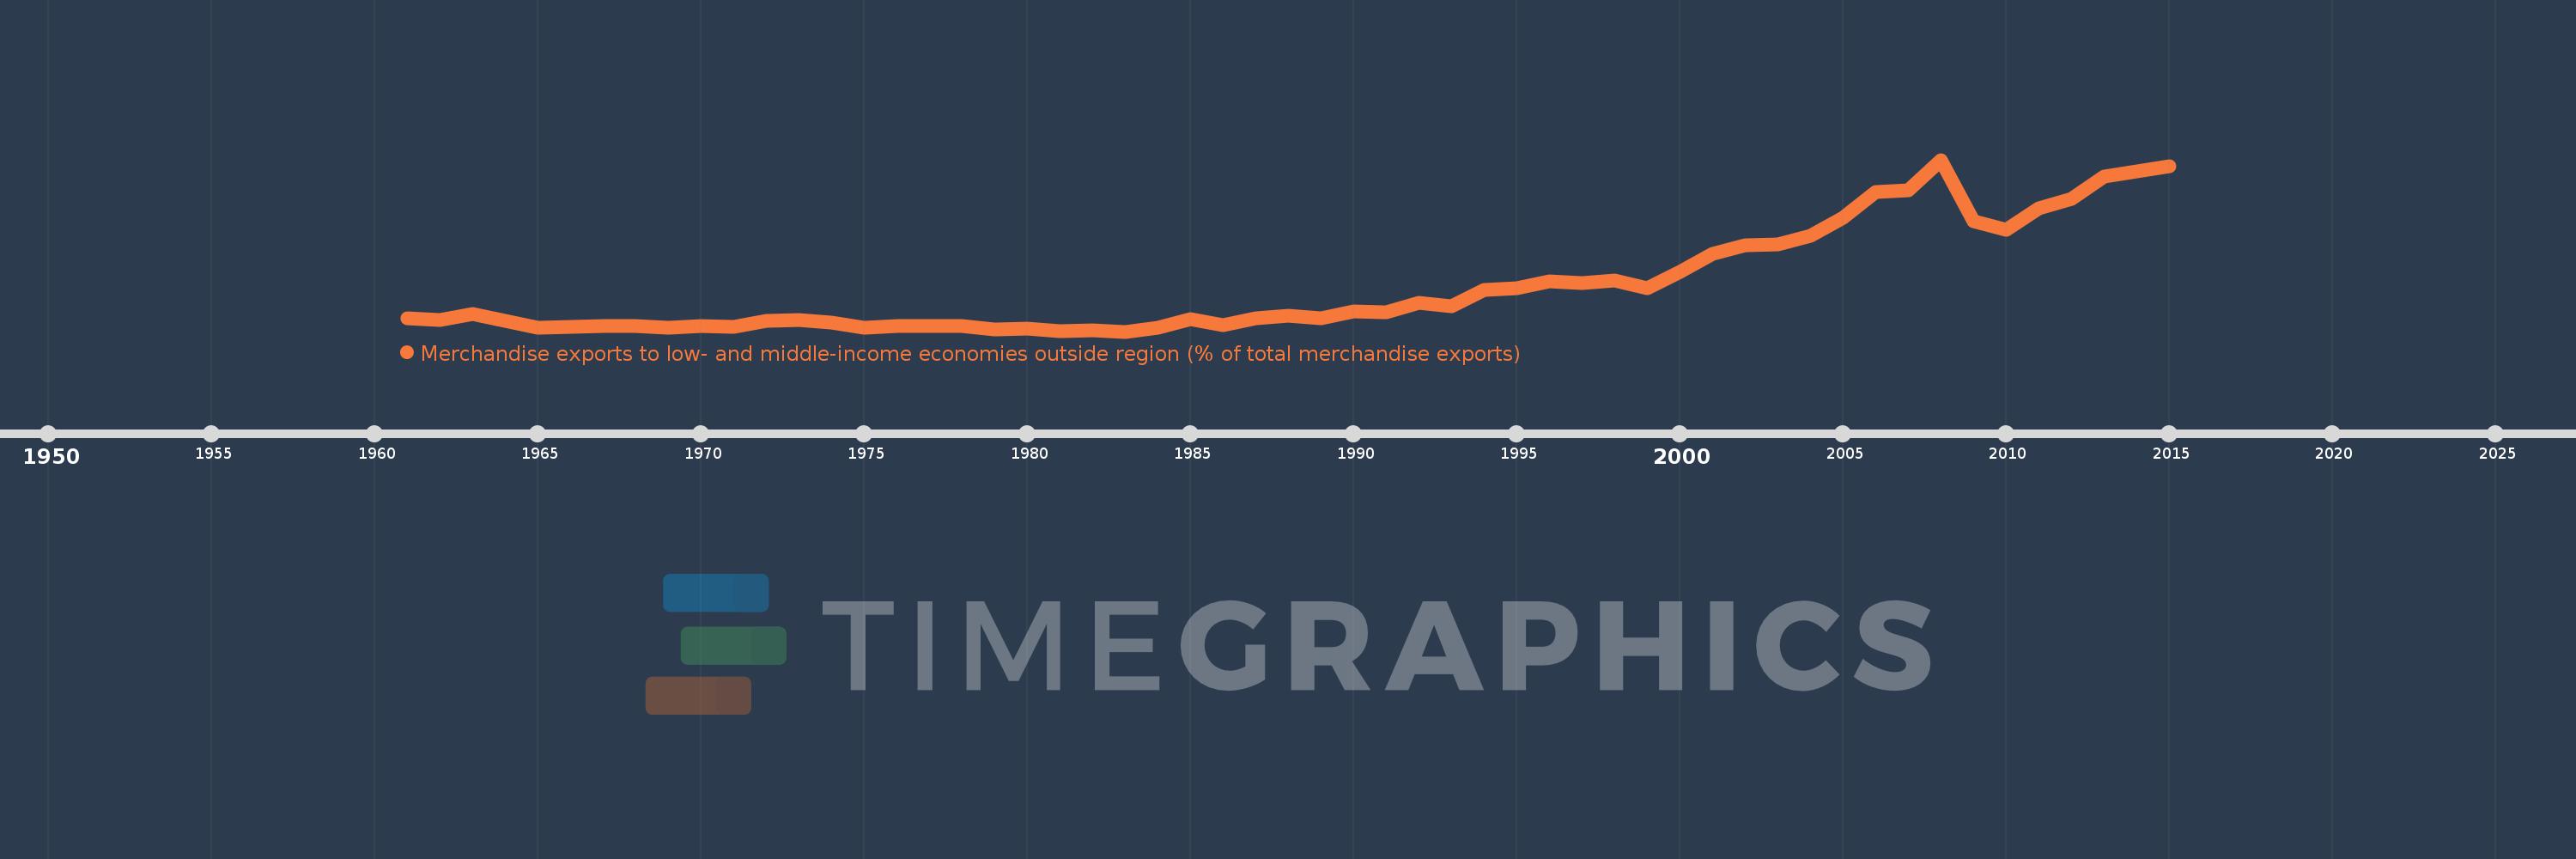
Heavily indebted poor countries (HIPC)
HPC
false
2
1
Merchandise exports to low- and middle-income economies outside region (% of total merchandise exports)
2015,2014,2013,2012,2011,2010,2009,2008,2007,2006,2005,2004,2003,2002,2001,2000,1999,1998,1997,1996,1995,1994,1993,1992,1991,1990,1989,1988,1987,1986,1985,1984,1983,1982,1981,1980,1979,1978,1977,1976,1975,1974,1973,1972,1971,1970,1969,1968,1967,1966,1965,1964,1963,1962,1961
Estas estatísticas em outros países:
AfghanistanAlbaniaAlgeriaAngolaArab WorldArgentinaArmeniaArubaAustraliaAustriaAzerbaijanBahamas, TheBahrainBangladeshBarbadosBelarusBelgiumBelizeBeninBermudaBoliviaBrazilBrunei DarussalamBulgariaBurundiCabo VerdeCambodiaCameroonCanadaCaribbean small statesCentral African RepublicCentral Europe and the BalticsChileChinaColombiaCongo, Dem. Rep.Congo, Rep.Costa RicaCote d'IvoireCroatiaCubaCyprusCzech RepublicDenmarkDominicaDominican RepublicEarly-demographic dividendEast Asia & PacificEast Asia & Pacific (excluding high income)East Asia & Pacific (IDA & IBRD countries)EcuadorEgypt, Arab Rep.El SalvadorEstoniaEthiopiaEuro areaEurope & Central AsiaEurope & Central Asia (excluding high income)Europe & Central Asia (IDA & IBRD countries)European UnionFijiFinlandFragile and conflict affected situationsFranceGabonGambia, TheGeorgiaGermanyGhanaGreeceGreenlandGuatemalaGuineaGuyanaHaitiHeavily indebted poor countries (HIPC)High incomeHondurasHong Kong SAR, ChinaHungaryIBRD onlyIcelandIDA & IBRD totalIDA blendIDA onlyIDA totalIndiaIndonesiaIran, Islamic Rep.IraqIrelandIsraelItalyJamaicaJapanJordanKazakhstanKenyaKorea, Dem. People’s Rep.Korea, Rep.KuwaitLao PDRLate-demographic dividendLatin America & Caribbean Latin America & Caribbean (excluding high income)Latin America & the Caribbean (IDA & IBRD countries)LatviaLeast developed countries: UN classificationLebanonLiberiaLibyaLithuaniaLow & middle incomeLow incomeLower middle incomeLuxembourgMacao SAR, ChinaMacedonia, FYRMadagascarMalawiMalaysiaMaliMaltaMauritaniaMauritiusMexicoMiddle East & North AfricaMiddle East & North Africa (excluding high income)Middle East & North Africa (IDA & IBRD countries)Middle incomeMoldovaMongoliaMontenegroMoroccoMozambiqueMyanmarNetherlandsNew CaledoniaNew ZealandNicaraguaNigerNigeriaNorth AmericaNorwayOECD membersOmanOther small statesPacific island small statesPakistanPanamaPapua New GuineaParaguayPeruPhilippinesPolandPortugalPost-demographic dividendPre-demographic dividendQatarRomaniaRussian FederationRwandaSamoaSaudi ArabiaSenegalSerbiaSeychellesSierra LeoneSingaporeSlovak RepublicSloveniaSmall statesSomaliaSouth AfricaSouth AsiaSouth Asia (IDA & IBRD)SpainSri LankaSt. LuciaSt. Vincent and the GrenadinesSub-Saharan Africa Sub-Saharan Africa (excluding high income)Sub-Saharan Africa (IDA & IBRD countries)SudanSurinameSwedenSwitzerlandSyrian Arab RepublicTanzaniaThailandTogoTrinidad and TobagoTunisiaTurkeyUgandaUkraineUnited Arab EmiratesUnited KingdomUnited StatesUpper middle incomeUruguayVenezuela, RBVietnamWorldYemen, Rep.ZambiaZimbabwe Linha do tempo:
Nesta escala de tempo está apresentado um gráfico de 1961 ano até 2015 ano Heavily indebted poor countries (HIPC). Dados de 1960 ano ausente. O número de observações reais por data: 55.
Fonte (nome):
Indicadores de desenvolvimento mundial
Fonte (organização):
World Bank staff estimates based data from International Monetary Fund's Direction of Trade database.
Categorias:
Private Sector, Trade
Foi atualizado:
23 abr 2017 ano
Indicadores de alterações dos valores ao longo dos anos
Mínimo:
0.544
1 jan 1983 ano
Máximo:
24.942
1 jan 2008 ano
Na data de observação
Valor
Mudança absoluta
A alteração em relação ao valor anterior
1 jan 1961 ano
2.45
+2.45
0.0%
1 jan 1962 ano
2.144
-0.305
-12.47%
1 jan 1963 ano
3.061
+0.917
42.76%
1 jan 1964 ano
2.032
-1.029
-33.62%
1 jan 1965 ano
1.141
-0.89
-43.82%
1 jan 1966 ano
1.227
+0.086
7.54%
1 jan 1967 ano
1.328
+0.101
8.21%
1 jan 1968 ano
1.28
-0.048
-3.61%
1 jan 1969 ano
1.077
-0.203
-15.86%
1 jan 1970 ano
1.322
+0.245
22.77%
1 jan 1971 ano
1.243
-0.08
-6.03%
1 jan 1972 ano
2.044
+0.802
64.5%
1 jan 1973 ano
2.132
+0.088
4.29%
1 jan 1974 ano
1.786
-0.346
-16.22%
1 jan 1975 ano
1.08
-0.706
-39.55%
1 jan 1976 ano
1.343
+0.264
24.43%
1 jan 1977 ano
1.342
-0.002
-0.12%
1 jan 1978 ano
1.32
-0.022
-1.65%
1 jan 1979 ano
0.887
-0.433
-32.78%
1 jan 1980 ano
0.995
+0.108
12.16%
1 jan 1981 ano
0.583
-0.412
-41.42%
1 jan 1982 ano
0.697
+0.114
19.52%
1 jan 1983 ano
0.544
-0.153
-21.97%
1 jan 1984 ano
1.121
+0.577
106.21%
1 jan 1985 ano
2.294
+1.173
104.6%
1 jan 1986 ano
1.488
-0.805
-35.12%
1 jan 1987 ano
2.477
+0.988
66.42%
1 jan 1988 ano
2.828
+0.351
14.19%
1 jan 1989 ano
2.455
-0.373
-13.17%
1 jan 1990 ano
3.358
+0.902
36.74%
1 jan 1991 ano
3.349
-0.009
-0.26%
1 jan 1992 ano
4.623
+1.274
38.05%
1 jan 1993 ano
4.17
-0.453
-9.8%
1 jan 1994 ano
6.404
+2.234
53.58%
1 jan 1995 ano
6.686
+0.282
4.4%
1 jan 1996 ano
7.736
+1.05
15.7%
1 jan 1997 ano
7.484
-0.251
-3.25%
1 jan 1998 ano
7.826
+0.342
4.57%
1 jan 1999 ano
6.686
-1.14
-14.57%
1 jan 2000 ano
9.012
+2.326
34.79%
1 jan 2001 ano
11.575
+2.563
28.44%
1 jan 2002 ano
12.787
+1.212
10.47%
1 jan 2003 ano
12.974
+0.187
1.46%
1 jan 2004 ano
14.085
+1.111
8.56%
1 jan 2005 ano
16.689
+2.604
18.49%
1 jan 2006 ano
20.337
+3.648
21.86%
1 jan 2007 ano
20.583
+0.246
1.21%
1 jan 2008 ano
24.942
+4.359
21.18%
1 jan 2009 ano
16.234
-8.709
-34.92%
1 jan 2010 ano
14.964
-1.27
-7.82%
1 jan 2011 ano
18.0
+3.036
20.29%
1 jan 2012 ano
19.342
+1.342
7.45%
1 jan 2013 ano
22.617
+3.276
16.94%
1 jan 2014 ano
23.33
+0.712
3.15%
1 jan 2015 ano
24.079
+0.749
3.21%
Classificação de países por estatísticas atuais por anos


Comentários: