29
/pt/
pt
AIzaSyAYiBZKx7MnpbEhh9jyipgxe19OcubqV5w
April 1, 2024
142071
Greece
GRC
true
2
1
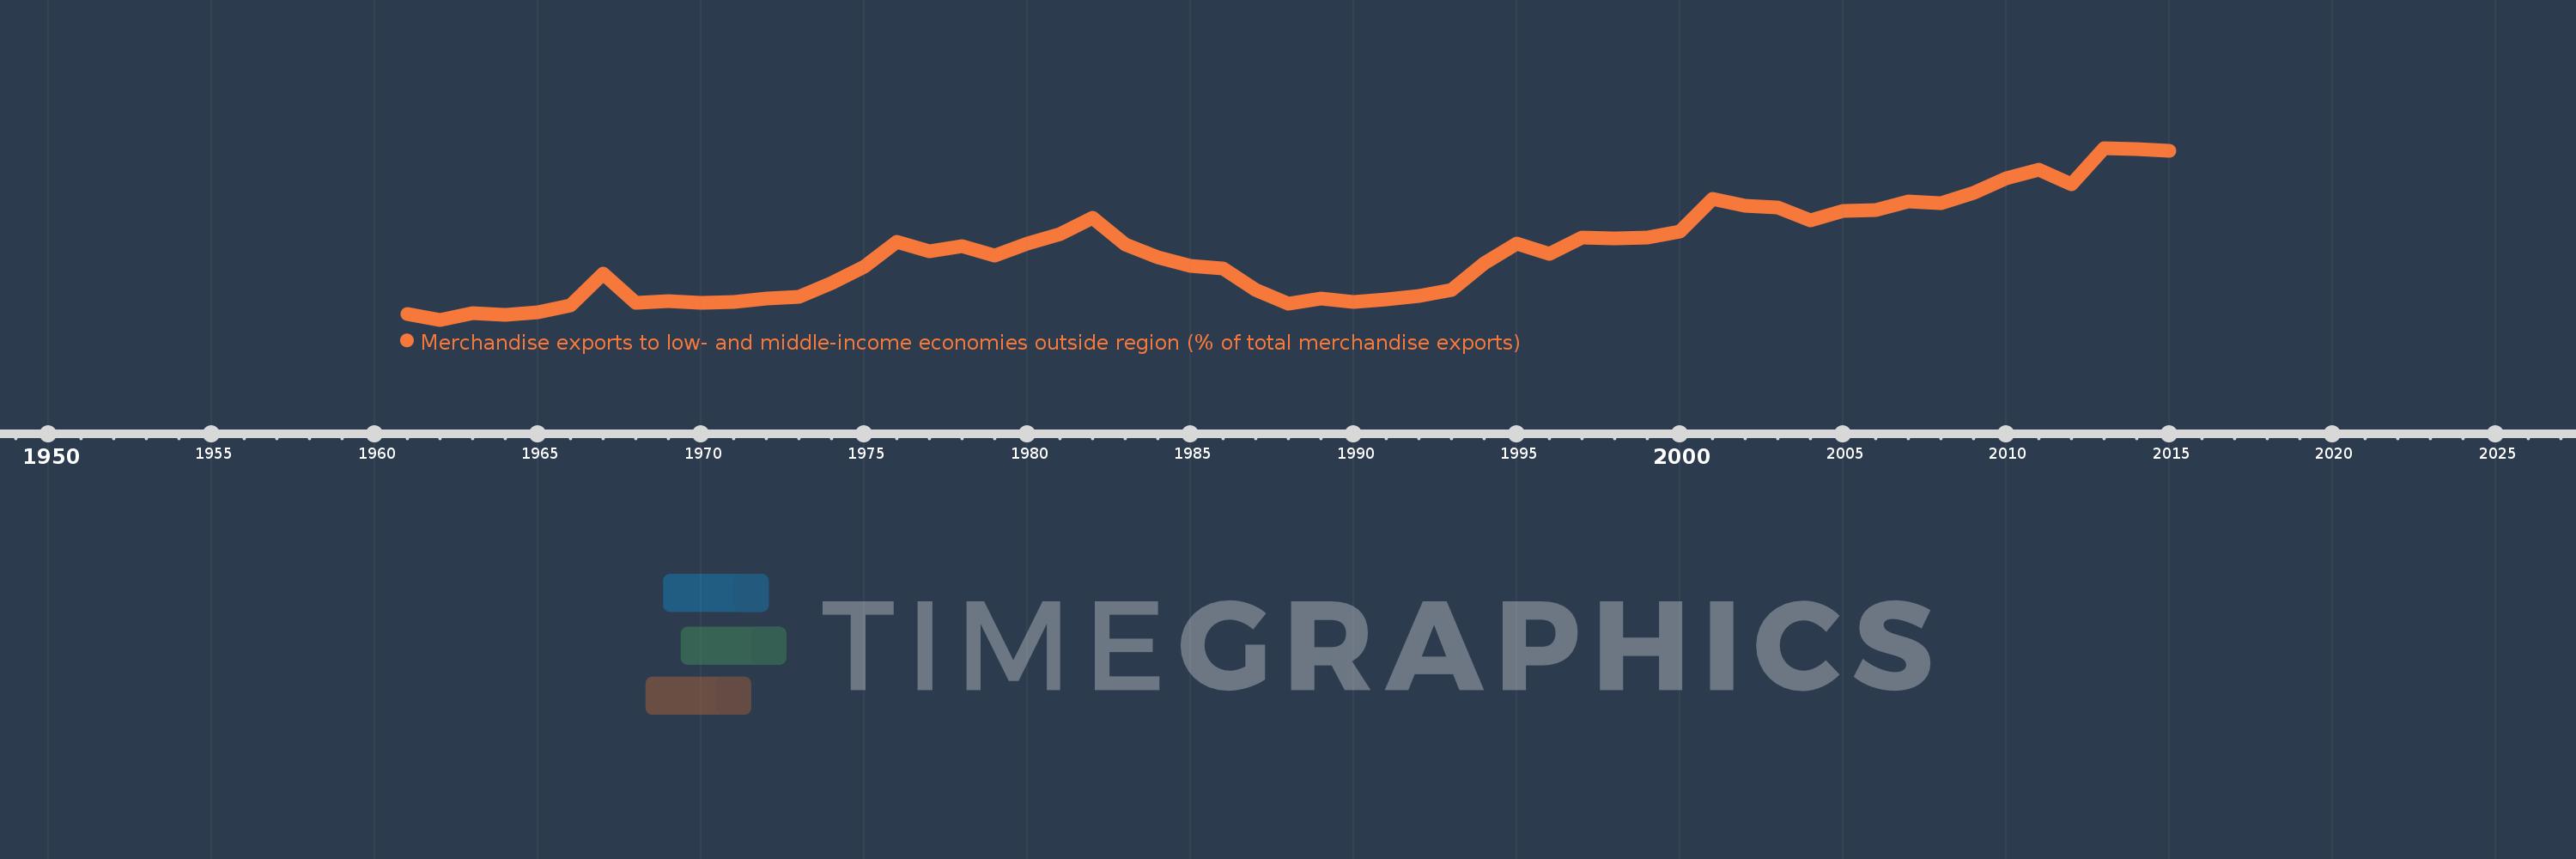
Merchandise exports to low- and middle-income economies outside region (% of total merchandise exports)
2015,2014,2013,2012,2011,2010,2009,2008,2007,2006,2005,2004,2003,2002,2001,2000,1999,1998,1997,1996,1995,1994,1993,1992,1991,1990,1989,1988,1987,1986,1985,1984,1983,1982,1981,1980,1979,1978,1977,1976,1975,1974,1973,1972,1971,1970,1969,1968,1967,1966,1965,1964,1963,1962,1961
Estas estatísticas em outros países:
AfghanistanAlbaniaAlgeriaAngolaArab WorldArgentinaArmeniaArubaAustraliaAustriaAzerbaijanBahamas, TheBahrainBangladeshBarbadosBelarusBelgiumBelizeBeninBermudaBoliviaBrazilBrunei DarussalamBulgariaBurundiCabo VerdeCambodiaCameroonCanadaCaribbean small statesCentral African RepublicCentral Europe and the BalticsChileChinaColombiaCongo, Dem. Rep.Congo, Rep.Costa RicaCote d'IvoireCroatiaCubaCyprusCzech RepublicDenmarkDominicaDominican RepublicEarly-demographic dividendEast Asia & PacificEast Asia & Pacific (excluding high income)East Asia & Pacific (IDA & IBRD countries)EcuadorEgypt, Arab Rep.El SalvadorEstoniaEthiopiaEuro areaEurope & Central AsiaEurope & Central Asia (excluding high income)Europe & Central Asia (IDA & IBRD countries)European UnionFijiFinlandFragile and conflict affected situationsFranceGabonGambia, TheGeorgiaGermanyGhanaGreeceGreenlandGuatemalaGuineaGuyanaHaitiHeavily indebted poor countries (HIPC)High incomeHondurasHong Kong SAR, ChinaHungaryIBRD onlyIcelandIDA & IBRD totalIDA blendIDA onlyIDA totalIndiaIndonesiaIran, Islamic Rep.IraqIrelandIsraelItalyJamaicaJapanJordanKazakhstanKenyaKorea, Dem. People’s Rep.Korea, Rep.KuwaitLao PDRLate-demographic dividendLatin America & Caribbean Latin America & Caribbean (excluding high income)Latin America & the Caribbean (IDA & IBRD countries)LatviaLeast developed countries: UN classificationLebanonLiberiaLibyaLithuaniaLow & middle incomeLow incomeLower middle incomeLuxembourgMacao SAR, ChinaMacedonia, FYRMadagascarMalawiMalaysiaMaliMaltaMauritaniaMauritiusMexicoMiddle East & North AfricaMiddle East & North Africa (excluding high income)Middle East & North Africa (IDA & IBRD countries)Middle incomeMoldovaMongoliaMontenegroMoroccoMozambiqueMyanmarNetherlandsNew CaledoniaNew ZealandNicaraguaNigerNigeriaNorth AmericaNorwayOECD membersOmanOther small statesPacific island small statesPakistanPanamaPapua New GuineaParaguayPeruPhilippinesPolandPortugalPost-demographic dividendPre-demographic dividendQatarRomaniaRussian FederationRwandaSamoaSaudi ArabiaSenegalSerbiaSeychellesSierra LeoneSingaporeSlovak RepublicSloveniaSmall statesSomaliaSouth AfricaSouth AsiaSouth Asia (IDA & IBRD)SpainSri LankaSt. LuciaSt. Vincent and the GrenadinesSub-Saharan Africa Sub-Saharan Africa (excluding high income)Sub-Saharan Africa (IDA & IBRD countries)SudanSurinameSwedenSwitzerlandSyrian Arab RepublicTanzaniaThailandTogoTrinidad and TobagoTunisiaTurkeyUgandaUkraineUnited Arab EmiratesUnited KingdomUnited StatesUpper middle incomeUruguayVenezuela, RBVietnamWorldYemen, Rep.ZambiaZimbabwe Linha do tempo:
Nesta escala de tempo está apresentado um gráfico de 1961 ano até 2015 ano Greece. Dados de 1960 ano ausente. O número de observações reais por data: 55.
Fonte (nome):
Indicadores de desenvolvimento mundial
Fonte (organização):
World Bank staff estimates based data from International Monetary Fund's Direction of Trade database.
Categorias:
Private Sector, Trade
Foi atualizado:
23 abr 2017 ano
Indicadores de alterações dos valores ao longo dos anos
Mínimo:
5.933
1 jan 1962 ano
Máximo:
40.073
1 jan 2013 ano
Na data de observação
Valor
Mudança absoluta
A alteração em relação ao valor anterior
1 jan 1961 ano
7.041
+7.041
0.0%
1 jan 1962 ano
5.933
-1.108
-15.74%
1 jan 1963 ano
7.33
+1.397
23.55%
1 jan 1964 ano
6.961
-0.369
-5.04%
1 jan 1965 ano
7.483
+0.522
7.5%
1 jan 1966 ano
8.791
+1.308
17.48%
1 jan 1967 ano
15.049
+6.258
71.19%
1 jan 1968 ano
9.337
-5.712
-37.96%
1 jan 1969 ano
9.639
+0.302
3.23%
1 jan 1970 ano
9.214
-0.425
-4.41%
1 jan 1971 ano
9.497
+0.283
3.07%
1 jan 1972 ano
10.102
+0.606
6.38%
1 jan 1973 ano
10.515
+0.413
4.09%
1 jan 1974 ano
13.267
+2.751
26.17%
1 jan 1975 ano
16.423
+3.156
23.79%
1 jan 1976 ano
21.357
+4.935
30.05%
1 jan 1977 ano
19.572
-1.786
-8.36%
1 jan 1978 ano
20.639
+1.068
5.46%
1 jan 1979 ano
18.687
-1.952
-9.46%
1 jan 1980 ano
21.093
+2.405
12.87%
1 jan 1981 ano
22.97
+1.877
8.9%
1 jan 1982 ano
26.214
+3.244
14.12%
1 jan 1983 ano
20.844
-5.37
-20.49%
1 jan 1984 ano
18.325
-2.519
-12.08%
1 jan 1985 ano
16.608
-1.717
-9.37%
1 jan 1986 ano
16.135
-0.473
-2.85%
1 jan 1987 ano
11.78
-4.354
-26.99%
1 jan 1988 ano
9.138
-2.642
-22.43%
1 jan 1989 ano
10.13
+0.992
10.85%
1 jan 1990 ano
9.518
-0.612
-6.04%
1 jan 1991 ano
9.991
+0.473
4.97%
1 jan 1992 ano
10.579
+0.588
5.89%
1 jan 1993 ano
11.814
+1.235
11.67%
1 jan 1994 ano
17.16
+5.346
45.25%
1 jan 1995 ano
21.148
+3.988
23.24%
1 jan 1996 ano
19.004
-2.144
-10.14%
1 jan 1997 ano
22.221
+3.217
16.93%
1 jan 1998 ano
22.178
-0.043
-0.2%
1 jan 1999 ano
22.271
+0.094
0.42%
1 jan 2000 ano
23.406
+1.135
5.1%
1 jan 2001 ano
30.009
+6.603
28.21%
1 jan 2002 ano
28.572
-1.437
-4.79%
1 jan 2003 ano
28.301
-0.271
-0.95%
1 jan 2004 ano
25.601
-2.7
-9.54%
1 jan 2005 ano
27.557
+1.956
7.64%
1 jan 2006 ano
27.719
+0.162
0.59%
1 jan 2007 ano
29.485
+1.766
6.37%
1 jan 2008 ano
29.173
-0.312
-1.06%
1 jan 2009 ano
31.072
+1.899
6.51%
1 jan 2010 ano
34.098
+3.026
9.74%
1 jan 2011 ano
35.778
+1.68
4.93%
1 jan 2012 ano
32.847
-2.931
-8.19%
1 jan 2013 ano
40.073
+7.226
22.0%
1 jan 2014 ano
39.849
-0.223
-0.56%
1 jan 2015 ano
39.442
-0.408
-1.02%
Classificação de países por estatísticas atuais por anos


Comentários: