29
/pt/
pt
AIzaSyAYiBZKx7MnpbEhh9jyipgxe19OcubqV5w
April 1, 2024
48320
Middle East & North Africa
MEA
false
2
1
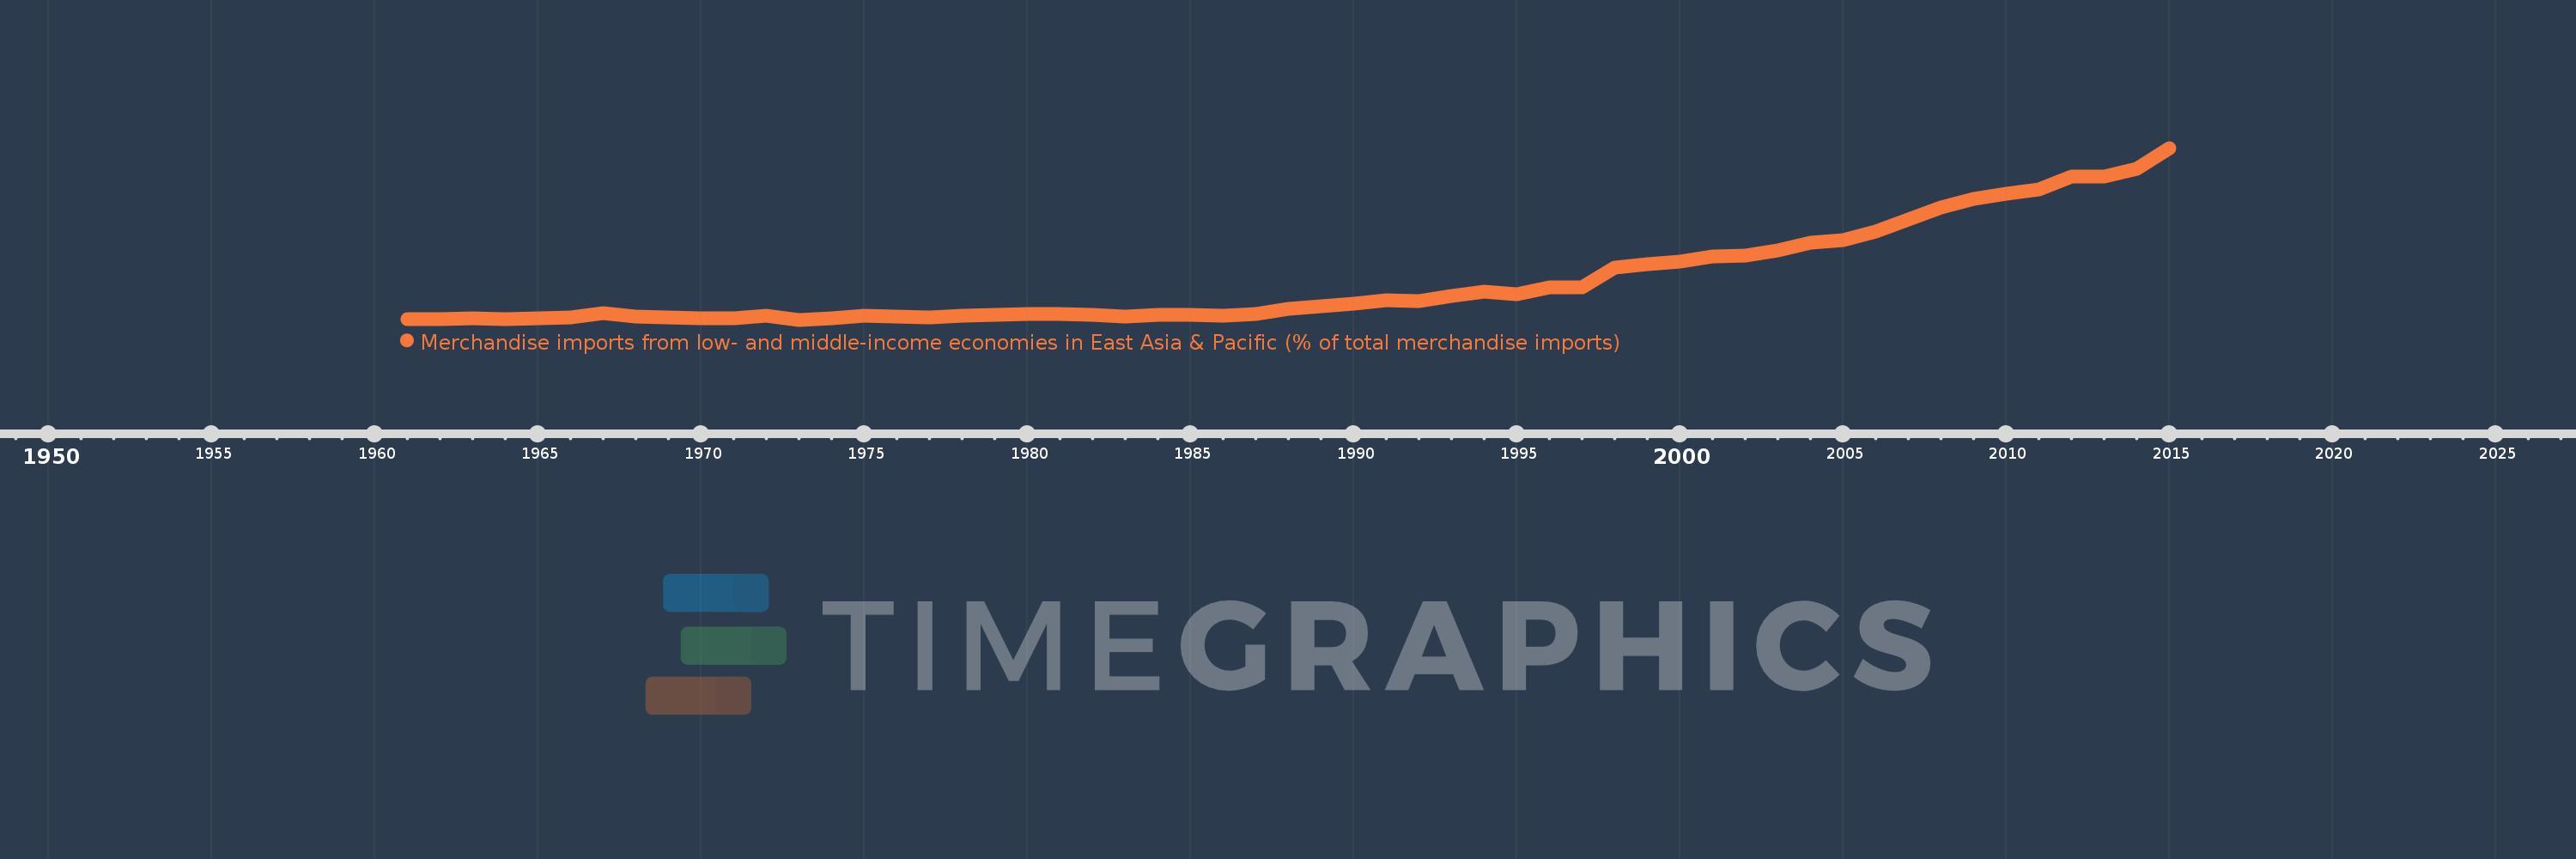
Merchandise imports from low- and middle-income economies in East Asia & Pacific (% of total merchandise imports)
2015,2014,2013,2012,2011,2010,2009,2008,2007,2006,2005,2004,2003,2002,2001,2000,1999,1998,1997,1996,1995,1994,1993,1992,1991,1990,1989,1988,1987,1986,1985,1984,1983,1982,1981,1980,1979,1978,1977,1976,1975,1974,1973,1972,1971,1970,1969,1968,1967,1966,1965,1964,1963,1962,1961
Estas estatísticas em outros países:
AfghanistanAlbaniaAlgeriaArab WorldArgentinaArmeniaArubaAustraliaAustriaAzerbaijanBahamas, TheBahrainBangladeshBarbadosBelarusBelgiumBelizeBeninBermudaBoliviaBrazilBrunei DarussalamBulgariaBurkina FasoBurundiCabo VerdeCambodiaCameroonCanadaCaribbean small statesCentral African RepublicCentral Europe and the BalticsChileChinaColombiaCongo, Rep.Costa RicaCote d'IvoireCroatiaCyprusCzech RepublicDenmarkDominicaDominican RepublicEarly-demographic dividendEast Asia & PacificEast Asia & Pacific (excluding high income)East Asia & Pacific (IDA & IBRD countries)EcuadorEgypt, Arab Rep.El SalvadorEstoniaEthiopiaEuro areaEurope & Central AsiaEurope & Central Asia (excluding high income)Europe & Central Asia (IDA & IBRD countries)European UnionFijiFinlandFragile and conflict affected situationsFranceFrench PolynesiaGabonGambia, TheGeorgiaGermanyGhanaGreeceGreenlandGrenadaGuatemalaHaitiHeavily indebted poor countries (HIPC)High incomeHondurasHong Kong SAR, ChinaHungaryIBRD onlyIcelandIDA & IBRD totalIDA blendIDA onlyIDA totalIndiaIndonesiaIran, Islamic Rep.IraqIrelandIsraelItalyJamaicaJapanJordanKazakhstanKenyaKorea, Dem. People’s Rep.Korea, Rep.KuwaitKyrgyz RepublicLao PDRLate-demographic dividendLatin America & Caribbean Latin America & Caribbean (excluding high income)Latin America & the Caribbean (IDA & IBRD countries)LatviaLeast developed countries: UN classificationLebanonLithuaniaLow & middle incomeLow incomeLower middle incomeLuxembourgMacao SAR, ChinaMacedonia, FYRMadagascarMalaysiaMaliMaltaMauritiusMexicoMiddle East & North AfricaMiddle East & North Africa (excluding high income)Middle East & North Africa (IDA & IBRD countries)Middle incomeMoldovaMongoliaMontenegroMoroccoMyanmarNetherlandsNew CaledoniaNew ZealandNicaraguaNigerNigeriaNorth AmericaNorwayOECD membersOmanOther small statesPacific island small statesPakistanPanamaPapua New GuineaParaguayPeruPhilippinesPolandPortugalPost-demographic dividendPre-demographic dividendQatarRomaniaRussian FederationSamoaSaudi ArabiaSenegalSerbiaSingaporeSlovak RepublicSloveniaSmall statesSolomon IslandsSomaliaSouth AfricaSouth AsiaSouth Asia (IDA & IBRD)SpainSri LankaSt. Kitts and NevisSt. LuciaSt. Vincent and the GrenadinesSub-Saharan Africa Sub-Saharan Africa (excluding high income)Sub-Saharan Africa (IDA & IBRD countries)SurinameSwedenSwitzerlandTanzaniaThailandTogoTongaTrinidad and TobagoTunisiaTurkeyUgandaUkraineUnited Arab EmiratesUnited KingdomUnited StatesUpper middle incomeUruguayVanuatuVenezuela, RBVietnamWorldYemen, Rep.ZambiaZimbabwe Linha do tempo:
Nesta escala de tempo está apresentado um gráfico de 1961 ano até 2015 ano Middle East & North Africa. Dados de 1960 ano ausente. O número de observações reais por data: 55.
Fonte (nome):
Indicadores de desenvolvimento mundial
Fonte (organização):
World Bank staff estimates based data from International Monetary Fund's Direction of Trade database.
Categorias:
Private Sector, Trade
Foi atualizado:
23 abr 2017 ano
Indicadores de alterações dos valores ao longo dos anos
Mínimo:
0.414
1 jan 1973 ano
Máximo:
16.938
1 jan 2015 ano
Na data de observação
Valor
Mudança absoluta
A alteração em relação ao valor anterior
1 jan 1961 ano
0.496
+0.496
0.0%
1 jan 1962 ano
0.453
-0.043
-8.7%
1 jan 1963 ano
0.593
+0.14
30.97%
1 jan 1964 ano
0.468
-0.125
-21.07%
1 jan 1965 ano
0.521
+0.052
11.15%
1 jan 1966 ano
0.622
+0.101
19.43%
1 jan 1967 ano
1.086
+0.465
74.73%
1 jan 1968 ano
0.749
-0.337
-31.06%
1 jan 1969 ano
0.605
-0.144
-19.16%
1 jan 1970 ano
0.517
-0.089
-14.63%
1 jan 1971 ano
0.583
+0.066
12.82%
1 jan 1972 ano
0.769
+0.186
31.91%
1 jan 1973 ano
0.414
-0.355
-46.2%
1 jan 1974 ano
0.594
+0.181
43.64%
1 jan 1975 ano
0.82
+0.226
37.96%
1 jan 1976 ano
0.693
-0.127
-15.53%
1 jan 1977 ano
0.676
-0.017
-2.46%
1 jan 1978 ano
0.814
+0.138
20.45%
1 jan 1979 ano
0.884
+0.07
8.58%
1 jan 1980 ano
0.94
+0.057
6.43%
1 jan 1981 ano
0.943
+0.002
0.26%
1 jan 1982 ano
0.86
-0.082
-8.75%
1 jan 1983 ano
0.705
-0.156
-18.12%
1 jan 1984 ano
0.868
+0.164
23.22%
1 jan 1985 ano
0.904
+0.036
4.11%
1 jan 1986 ano
0.843
-0.061
-6.74%
1 jan 1987 ano
0.974
+0.131
15.59%
1 jan 1988 ano
1.464
+0.49
50.31%
1 jan 1989 ano
1.681
+0.217
14.79%
1 jan 1990 ano
1.998
+0.317
18.86%
1 jan 1991 ano
2.311
+0.313
15.68%
1 jan 1992 ano
2.231
-0.08
-3.45%
1 jan 1993 ano
2.725
+0.494
22.13%
1 jan 1994 ano
3.075
+0.349
12.82%
1 jan 1995 ano
2.844
-0.231
-7.5%
1 jan 1996 ano
3.549
+0.705
24.79%
1 jan 1997 ano
3.539
-0.01
-0.27%
1 jan 1998 ano
5.456
+1.917
54.17%
1 jan 1999 ano
5.775
+0.319
5.85%
1 jan 2000 ano
5.983
+0.208
3.6%
1 jan 2001 ano
6.526
+0.542
9.07%
1 jan 2002 ano
6.569
+0.043
0.66%
1 jan 2003 ano
7.046
+0.478
7.27%
1 jan 2004 ano
7.793
+0.746
10.59%
1 jan 2005 ano
8.07
+0.278
3.56%
1 jan 2006 ano
8.87
+0.8
9.91%
1 jan 2007 ano
10.049
+1.18
13.3%
1 jan 2008 ano
11.211
+1.162
11.56%
1 jan 2009 ano
12.009
+0.798
7.12%
1 jan 2010 ano
12.498
+0.488
4.07%
1 jan 2011 ano
12.907
+0.41
3.28%
1 jan 2012 ano
14.193
+1.286
9.96%
1 jan 2013 ano
14.169
-0.025
-0.17%
1 jan 2014 ano
14.897
+0.728
5.14%
1 jan 2015 ano
16.938
+2.042
13.7%
Classificação de países por estatísticas atuais por anos


Comentários: