29
/pt/
pt
AIzaSyAYiBZKx7MnpbEhh9jyipgxe19OcubqV5w
April 1, 2024
133404
Finland
FIN
true
2
1
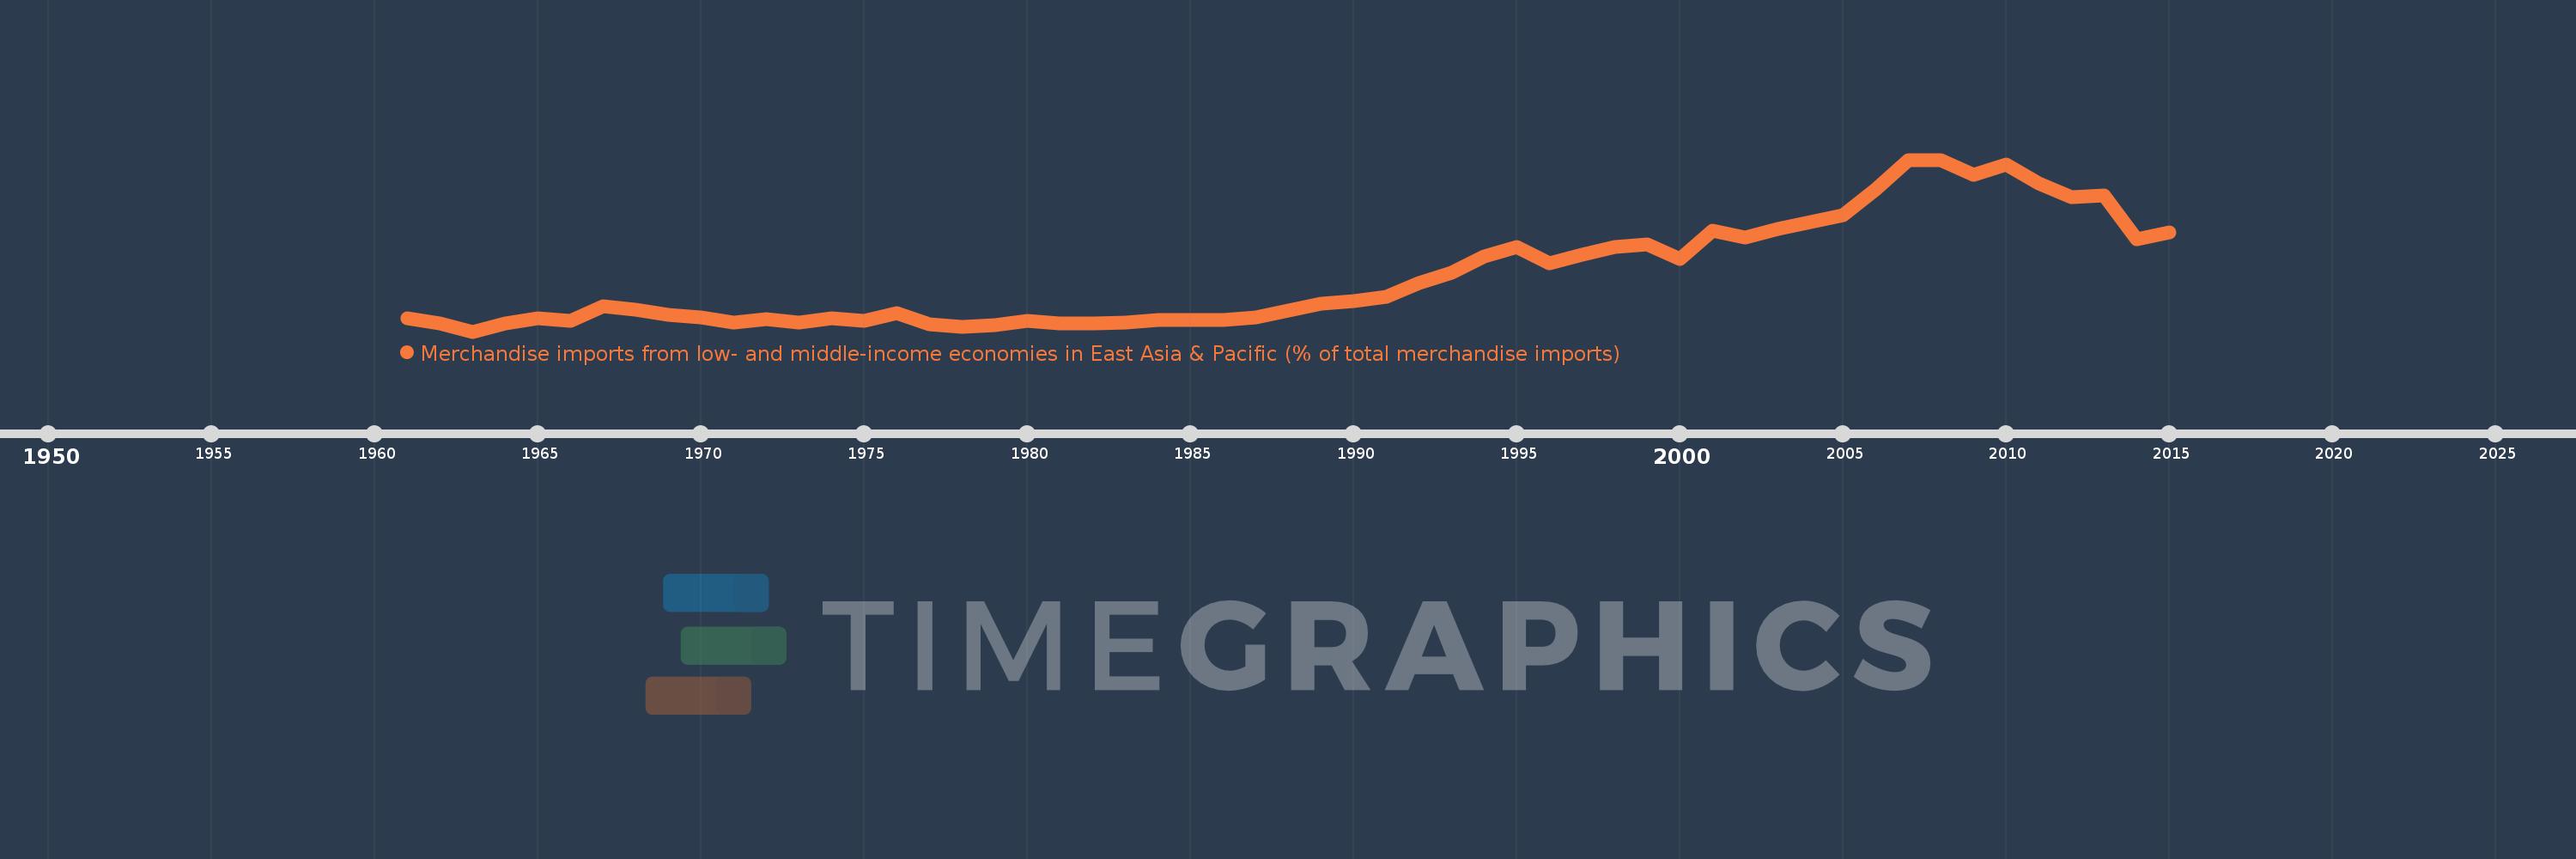
Merchandise imports from low- and middle-income economies in East Asia & Pacific (% of total merchandise imports)
2015,2014,2013,2012,2011,2010,2009,2008,2007,2006,2005,2004,2003,2002,2001,2000,1999,1998,1997,1996,1995,1994,1993,1992,1991,1990,1989,1988,1987,1986,1985,1984,1983,1982,1981,1980,1979,1978,1977,1976,1975,1974,1973,1972,1971,1970,1969,1968,1967,1966,1965,1964,1963,1962,1961
Estas estatísticas em outros países:
AfghanistanAlbaniaAlgeriaArab WorldArgentinaArmeniaArubaAustraliaAustriaAzerbaijanBahamas, TheBahrainBangladeshBarbadosBelarusBelgiumBelizeBeninBermudaBoliviaBrazilBrunei DarussalamBulgariaBurkina FasoBurundiCabo VerdeCambodiaCameroonCanadaCaribbean small statesCentral African RepublicCentral Europe and the BalticsChileChinaColombiaCongo, Rep.Costa RicaCote d'IvoireCroatiaCyprusCzech RepublicDenmarkDominicaDominican RepublicEarly-demographic dividendEast Asia & PacificEast Asia & Pacific (excluding high income)East Asia & Pacific (IDA & IBRD countries)EcuadorEgypt, Arab Rep.El SalvadorEstoniaEthiopiaEuro areaEurope & Central AsiaEurope & Central Asia (excluding high income)Europe & Central Asia (IDA & IBRD countries)European UnionFijiFinlandFragile and conflict affected situationsFranceFrench PolynesiaGabonGambia, TheGeorgiaGermanyGhanaGreeceGreenlandGrenadaGuatemalaHaitiHeavily indebted poor countries (HIPC)High incomeHondurasHong Kong SAR, ChinaHungaryIBRD onlyIcelandIDA & IBRD totalIDA blendIDA onlyIDA totalIndiaIndonesiaIran, Islamic Rep.IraqIrelandIsraelItalyJamaicaJapanJordanKazakhstanKenyaKorea, Dem. People’s Rep.Korea, Rep.KuwaitKyrgyz RepublicLao PDRLate-demographic dividendLatin America & Caribbean Latin America & Caribbean (excluding high income)Latin America & the Caribbean (IDA & IBRD countries)LatviaLeast developed countries: UN classificationLebanonLithuaniaLow & middle incomeLow incomeLower middle incomeLuxembourgMacao SAR, ChinaMacedonia, FYRMadagascarMalaysiaMaliMaltaMauritiusMexicoMiddle East & North AfricaMiddle East & North Africa (excluding high income)Middle East & North Africa (IDA & IBRD countries)Middle incomeMoldovaMongoliaMontenegroMoroccoMyanmarNetherlandsNew CaledoniaNew ZealandNicaraguaNigerNigeriaNorth AmericaNorwayOECD membersOmanOther small statesPacific island small statesPakistanPanamaPapua New GuineaParaguayPeruPhilippinesPolandPortugalPost-demographic dividendPre-demographic dividendQatarRomaniaRussian FederationSamoaSaudi ArabiaSenegalSerbiaSingaporeSlovak RepublicSloveniaSmall statesSolomon IslandsSomaliaSouth AfricaSouth AsiaSouth Asia (IDA & IBRD)SpainSri LankaSt. Kitts and NevisSt. LuciaSt. Vincent and the GrenadinesSub-Saharan Africa Sub-Saharan Africa (excluding high income)Sub-Saharan Africa (IDA & IBRD countries)SurinameSwedenSwitzerlandTanzaniaThailandTogoTongaTrinidad and TobagoTunisiaTurkeyUgandaUkraineUnited Arab EmiratesUnited KingdomUnited StatesUpper middle incomeUruguayVanuatuVenezuela, RBVietnamWorldYemen, Rep.ZambiaZimbabwe Linha do tempo:
Nesta escala de tempo está apresentado um gráfico de 1961 ano até 2015 ano Finland. Dados de 1960 ano ausente. O número de observações reais por data: 55.
Fonte (nome):
Indicadores de desenvolvimento mundial
Fonte (organização):
World Bank staff estimates based data from International Monetary Fund's Direction of Trade database.
Categorias:
Private Sector, Trade
Foi atualizado:
23 abr 2017 ano
Indicadores de alterações dos valores ao longo dos anos
Mínimo:
0.171
1 jan 1963 ano
Máximo:
6.472
1 jan 2007 ano
Na data de observação
Valor
Mudança absoluta
A alteração em relação ao valor anterior
1 jan 1961 ano
0.674
+0.674
0.0%
1 jan 1962 ano
0.463
-0.211
-31.33%
1 jan 1963 ano
0.171
-0.292
-63.03%
1 jan 1964 ano
0.474
+0.303
177.21%
1 jan 1965 ano
0.668
+0.194
40.82%
1 jan 1966 ano
0.566
-0.101
-15.17%
1 jan 1967 ano
1.106
+0.539
95.24%
1 jan 1968 ano
0.985
-0.121
-10.96%
1 jan 1969 ano
0.779
-0.206
-20.92%
1 jan 1970 ano
0.678
-0.101
-12.97%
1 jan 1971 ano
0.506
-0.171
-25.3%
1 jan 1972 ano
0.616
+0.109
21.61%
1 jan 1973 ano
0.514
-0.102
-16.58%
1 jan 1974 ano
0.648
+0.135
26.27%
1 jan 1975 ano
0.552
-0.096
-14.83%
1 jan 1976 ano
0.861
+0.309
55.96%
1 jan 1977 ano
0.43
-0.431
-50.03%
1 jan 1978 ano
0.344
-0.087
-20.11%
1 jan 1979 ano
0.422
+0.078
22.64%
1 jan 1980 ano
0.553
+0.131
31.04%
1 jan 1981 ano
0.466
-0.086
-15.64%
1 jan 1982 ano
0.477
+0.011
2.29%
1 jan 1983 ano
0.51
+0.033
6.9%
1 jan 1984 ano
0.592
+0.083
16.23%
1 jan 1985 ano
0.611
+0.019
3.17%
1 jan 1986 ano
0.594
-0.017
-2.73%
1 jan 1987 ano
0.686
+0.091
15.35%
1 jan 1988 ano
0.939
+0.253
36.93%
1 jan 1989 ano
1.185
+0.246
26.2%
1 jan 1990 ano
1.282
+0.097
8.17%
1 jan 1991 ano
1.448
+0.166
12.96%
1 jan 1992 ano
1.949
+0.501
34.57%
1 jan 1993 ano
2.318
+0.37
18.98%
1 jan 1994 ano
2.922
+0.604
26.04%
1 jan 1995 ano
3.263
+0.341
11.68%
1 jan 1996 ano
2.691
-0.572
-17.53%
1 jan 1997 ano
2.98
+0.289
10.74%
1 jan 1998 ano
3.268
+0.288
9.65%
1 jan 1999 ano
3.382
+0.114
3.49%
1 jan 2000 ano
2.824
-0.559
-16.52%
1 jan 2001 ano
3.887
+1.063
37.65%
1 jan 2002 ano
3.612
-0.275
-7.08%
1 jan 2003 ano
3.927
+0.315
8.74%
1 jan 2004 ano
4.176
+0.249
6.33%
1 jan 2005 ano
4.446
+0.27
6.47%
1 jan 2006 ano
5.371
+0.925
20.81%
1 jan 2007 ano
6.472
+1.101
20.5%
1 jan 2008 ano
6.471
-0.001
-0.02%
1 jan 2009 ano
5.92
-0.55
-8.5%
1 jan 2010 ano
6.285
+0.364
6.16%
1 jan 2011 ano
5.59
-0.695
-11.06%
1 jan 2012 ano
5.114
-0.476
-8.52%
1 jan 2013 ano
5.159
+0.045
0.88%
1 jan 2014 ano
3.548
-1.611
-31.23%
1 jan 2015 ano
3.819
+0.271
7.64%
Classificação de países por estatísticas atuais por anos


Comentários: