29
/pt/
pt
AIzaSyAYiBZKx7MnpbEhh9jyipgxe19OcubqV5w
April 1, 2024
31827
Europe & Central Asia (excluding high income)
ECA
false
2
1
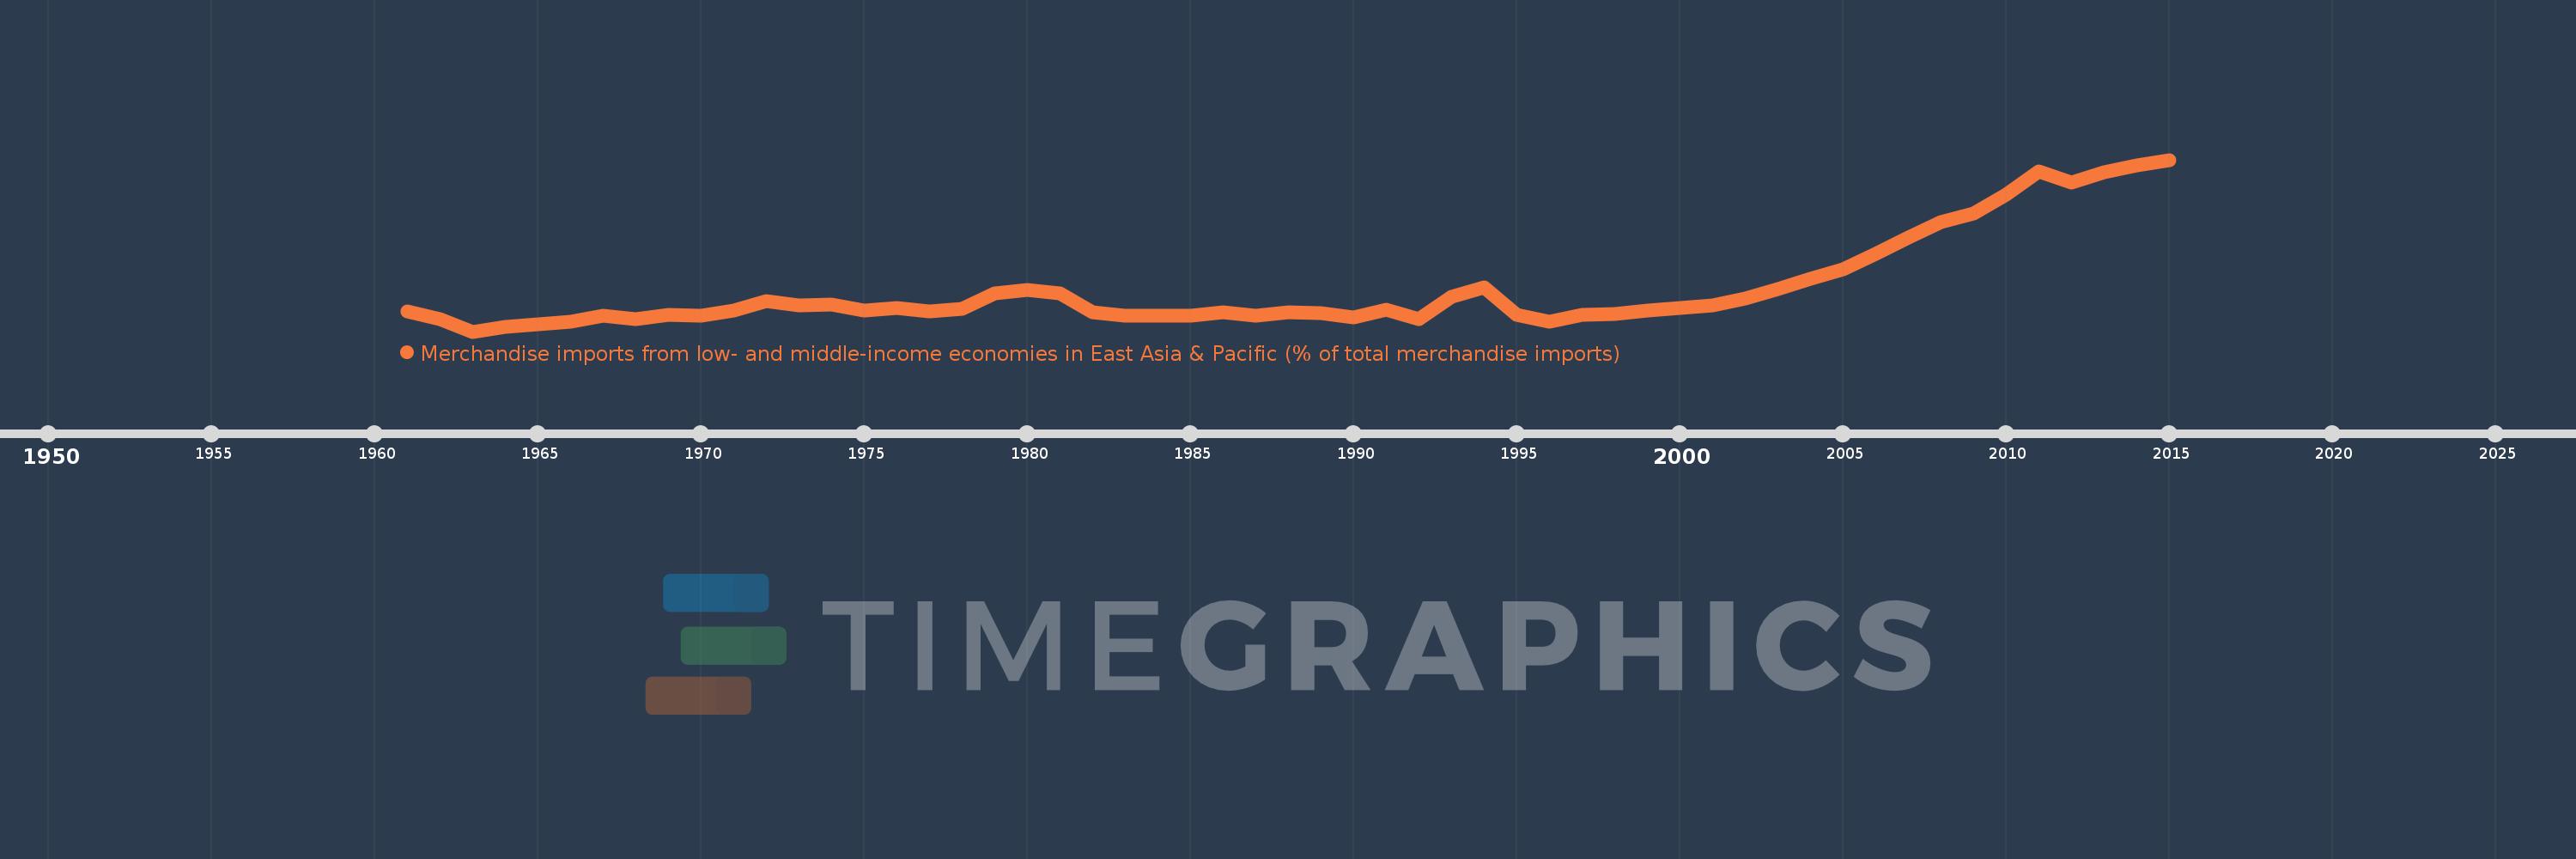
Merchandise imports from low- and middle-income economies in East Asia & Pacific (% of total merchandise imports)
2015,2014,2013,2012,2011,2010,2009,2008,2007,2006,2005,2004,2003,2002,2001,2000,1999,1998,1997,1996,1995,1994,1993,1992,1991,1990,1989,1988,1987,1986,1985,1984,1983,1982,1981,1980,1979,1978,1977,1976,1975,1974,1973,1972,1971,1970,1969,1968,1967,1966,1965,1964,1963,1962,1961
Estas estatísticas em outros países:
AfghanistanAlbaniaAlgeriaArab WorldArgentinaArmeniaArubaAustraliaAustriaAzerbaijanBahamas, TheBahrainBangladeshBarbadosBelarusBelgiumBelizeBeninBermudaBoliviaBrazilBrunei DarussalamBulgariaBurkina FasoBurundiCabo VerdeCambodiaCameroonCanadaCaribbean small statesCentral African RepublicCentral Europe and the BalticsChileChinaColombiaCongo, Rep.Costa RicaCote d'IvoireCroatiaCyprusCzech RepublicDenmarkDominicaDominican RepublicEarly-demographic dividendEast Asia & PacificEast Asia & Pacific (excluding high income)East Asia & Pacific (IDA & IBRD countries)EcuadorEgypt, Arab Rep.El SalvadorEstoniaEthiopiaEuro areaEurope & Central AsiaEurope & Central Asia (excluding high income)Europe & Central Asia (IDA & IBRD countries)European UnionFijiFinlandFragile and conflict affected situationsFranceFrench PolynesiaGabonGambia, TheGeorgiaGermanyGhanaGreeceGreenlandGrenadaGuatemalaHaitiHeavily indebted poor countries (HIPC)High incomeHondurasHong Kong SAR, ChinaHungaryIBRD onlyIcelandIDA & IBRD totalIDA blendIDA onlyIDA totalIndiaIndonesiaIran, Islamic Rep.IraqIrelandIsraelItalyJamaicaJapanJordanKazakhstanKenyaKorea, Dem. People’s Rep.Korea, Rep.KuwaitKyrgyz RepublicLao PDRLate-demographic dividendLatin America & Caribbean Latin America & Caribbean (excluding high income)Latin America & the Caribbean (IDA & IBRD countries)LatviaLeast developed countries: UN classificationLebanonLithuaniaLow & middle incomeLow incomeLower middle incomeLuxembourgMacao SAR, ChinaMacedonia, FYRMadagascarMalaysiaMaliMaltaMauritiusMexicoMiddle East & North AfricaMiddle East & North Africa (excluding high income)Middle East & North Africa (IDA & IBRD countries)Middle incomeMoldovaMongoliaMontenegroMoroccoMyanmarNetherlandsNew CaledoniaNew ZealandNicaraguaNigerNigeriaNorth AmericaNorwayOECD membersOmanOther small statesPacific island small statesPakistanPanamaPapua New GuineaParaguayPeruPhilippinesPolandPortugalPost-demographic dividendPre-demographic dividendQatarRomaniaRussian FederationSamoaSaudi ArabiaSenegalSerbiaSingaporeSlovak RepublicSloveniaSmall statesSolomon IslandsSomaliaSouth AfricaSouth AsiaSouth Asia (IDA & IBRD)SpainSri LankaSt. Kitts and NevisSt. LuciaSt. Vincent and the GrenadinesSub-Saharan Africa Sub-Saharan Africa (excluding high income)Sub-Saharan Africa (IDA & IBRD countries)SurinameSwedenSwitzerlandTanzaniaThailandTogoTongaTrinidad and TobagoTunisiaTurkeyUgandaUkraineUnited Arab EmiratesUnited KingdomUnited StatesUpper middle incomeUruguayVanuatuVenezuela, RBVietnamWorldYemen, Rep.ZambiaZimbabwe Linha do tempo:
Nesta escala de tempo está apresentado um gráfico de 1961 ano até 2015 ano Europe & Central Asia (excluding high income). Dados de 1960 ano ausente. O número de observações reais por data: 55.
Fonte (nome):
Indicadores de desenvolvimento mundial
Fonte (organização):
World Bank staff estimates based data from International Monetary Fund's Direction of Trade database.
Categorias:
Private Sector, Trade
Foi atualizado:
23 abr 2017 ano
Indicadores de alterações dos valores ao longo dos anos
Mínimo:
0.958
1 jan 1963 ano
Máximo:
14.138
1 jan 2015 ano
Na data de observação
Valor
Mudança absoluta
A alteração em relação ao valor anterior
1 jan 1961 ano
2.536
+2.536
0.0%
1 jan 1962 ano
1.919
-0.617
-24.33%
1 jan 1963 ano
0.958
-0.961
-50.09%
1 jan 1964 ano
1.348
+0.39
40.75%
1 jan 1965 ano
1.524
+0.176
13.06%
1 jan 1966 ano
1.745
+0.221
14.49%
1 jan 1967 ano
2.151
+0.406
23.26%
1 jan 1968 ano
1.887
-0.264
-12.26%
1 jan 1969 ano
2.273
+0.386
20.44%
1 jan 1970 ano
2.153
-0.119
-5.26%
1 jan 1971 ano
2.572
+0.419
19.45%
1 jan 1972 ano
3.324
+0.752
29.23%
1 jan 1973 ano
2.94
-0.384
-11.55%
1 jan 1974 ano
3.031
+0.091
3.1%
1 jan 1975 ano
2.589
-0.441
-14.57%
1 jan 1976 ano
2.802
+0.213
8.21%
1 jan 1977 ano
2.483
-0.319
-11.4%
1 jan 1978 ano
2.702
+0.22
8.85%
1 jan 1979 ano
3.871
+1.169
43.25%
1 jan 1980 ano
4.149
+0.278
7.17%
1 jan 1981 ano
3.923
-0.226
-5.45%
1 jan 1982 ano
2.419
-1.504
-38.35%
1 jan 1983 ano
2.168
-0.251
-10.37%
1 jan 1984 ano
2.193
+0.025
1.16%
1 jan 1985 ano
2.149
-0.044
-1.99%
1 jan 1986 ano
2.428
+0.278
12.96%
1 jan 1987 ano
2.146
-0.282
-11.6%
1 jan 1988 ano
2.419
+0.272
12.69%
1 jan 1989 ano
2.369
-0.05
-2.07%
1 jan 1990 ano
2.025
-0.343
-14.48%
1 jan 1991 ano
2.608
+0.583
28.76%
1 jan 1992 ano
1.926
-0.682
-26.17%
1 jan 1993 ano
3.63
+1.704
88.52%
1 jan 1994 ano
4.362
+0.732
20.17%
1 jan 1995 ano
2.254
-2.108
-48.33%
1 jan 1996 ano
1.741
-0.514
-22.78%
1 jan 1997 ano
2.275
+0.534
30.68%
1 jan 1998 ano
2.301
+0.027
1.18%
1 jan 1999 ano
2.557
+0.256
11.11%
1 jan 2000 ano
2.789
+0.231
9.05%
1 jan 2001 ano
2.973
+0.184
6.59%
1 jan 2002 ano
3.481
+0.509
17.12%
1 jan 2003 ano
4.225
+0.744
21.37%
1 jan 2004 ano
5.011
+0.786
18.6%
1 jan 2005 ano
5.724
+0.713
14.22%
1 jan 2006 ano
6.908
+1.185
20.7%
1 jan 2007 ano
8.203
+1.295
18.74%
1 jan 2008 ano
9.367
+1.164
14.19%
1 jan 2009 ano
10.015
+0.647
6.91%
1 jan 2010 ano
11.473
+1.458
14.56%
1 jan 2011 ano
13.226
+1.753
15.28%
1 jan 2012 ano
12.423
-0.803
-6.07%
1 jan 2013 ano
13.17
+0.747
6.01%
1 jan 2014 ano
13.739
+0.569
4.32%
1 jan 2015 ano
14.138
+0.399
2.91%
Classificação de países por estatísticas atuais por anos


Comentários: