29
/pt/
pt
AIzaSyAYiBZKx7MnpbEhh9jyipgxe19OcubqV5w
April 1, 2024
111215
Congo, Rep.
COG
true
2
1
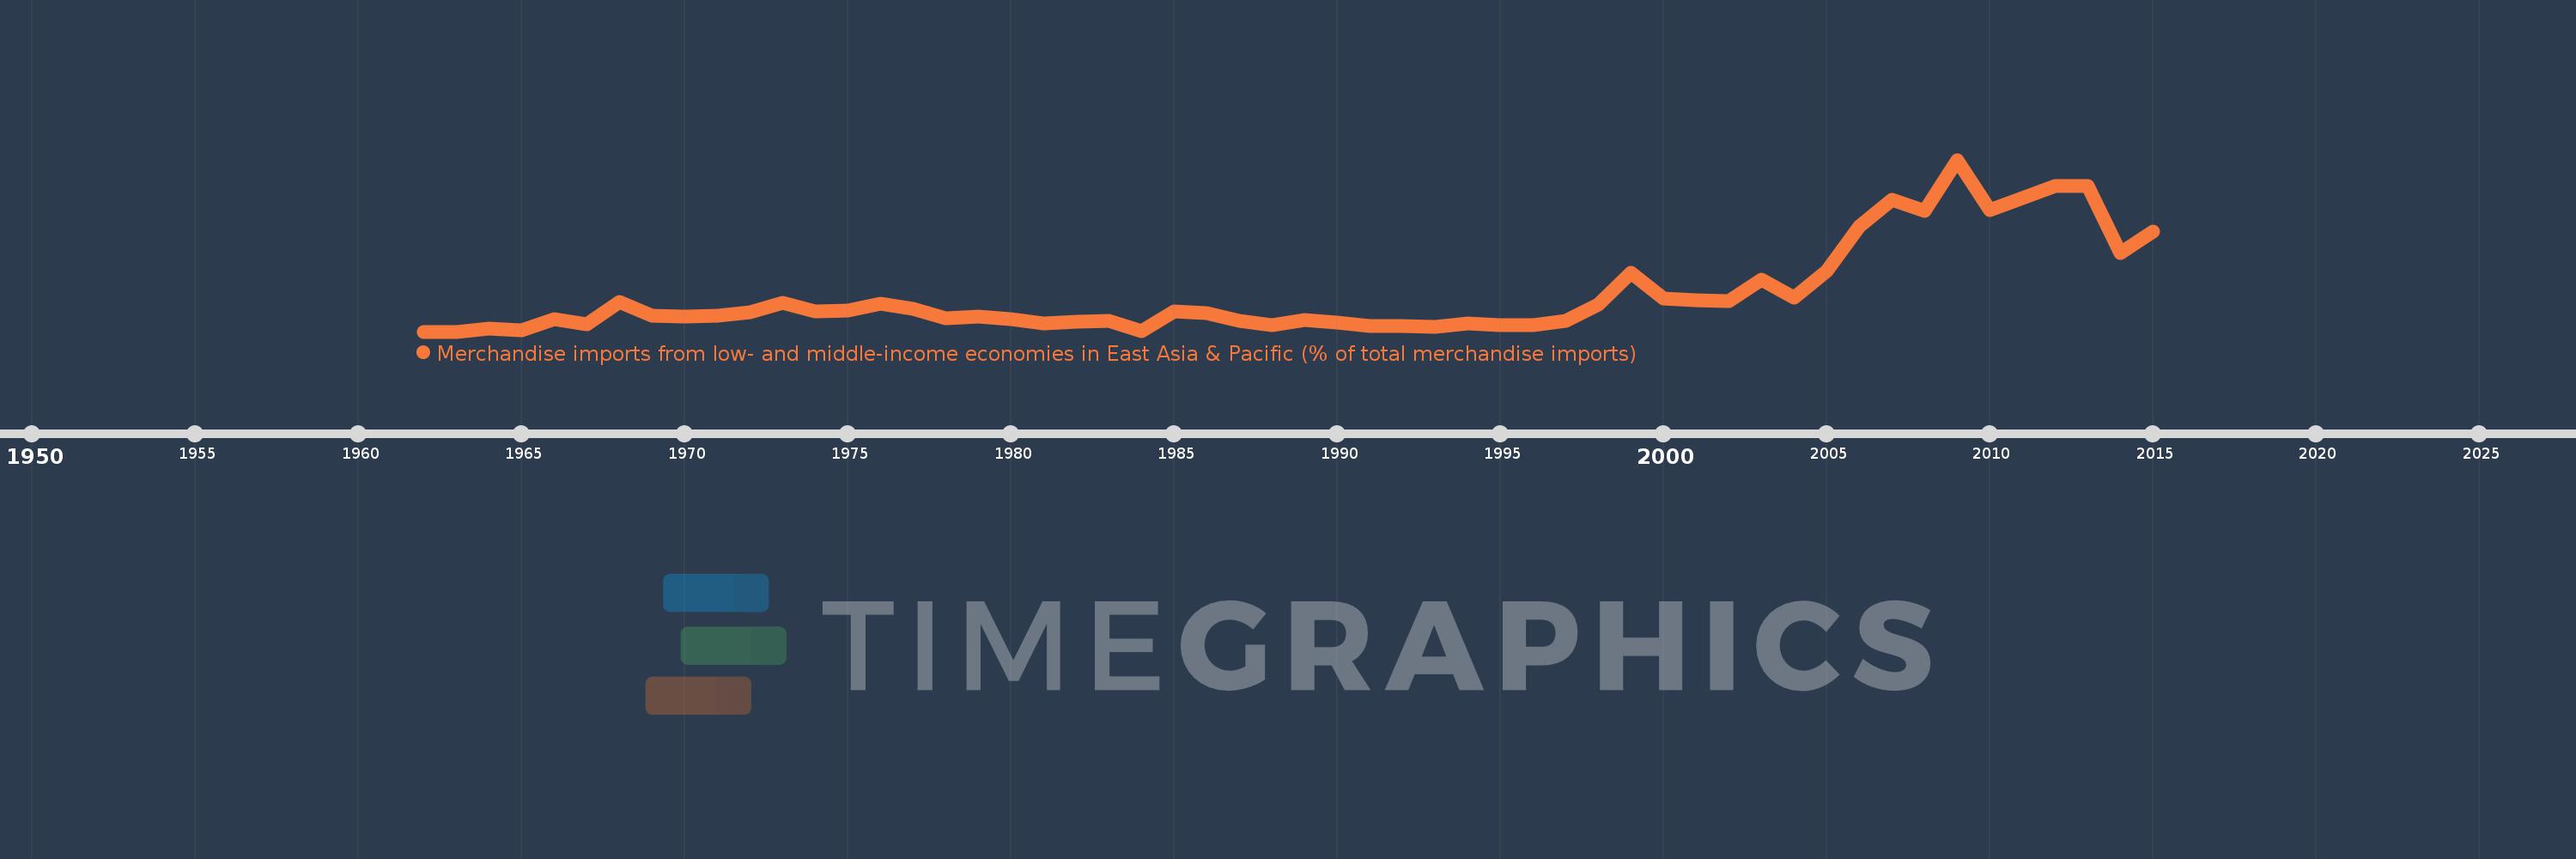
Merchandise imports from low- and middle-income economies in East Asia & Pacific (% of total merchandise imports)
2015,2014,2013,2012,2011,2010,2009,2008,2007,2006,2005,2004,2003,2002,2001,2000,1999,1998,1997,1996,1995,1994,1993,1992,1991,1990,1989,1988,1987,1986,1985,1984,1983,1982,1981,1980,1979,1978,1977,1976,1975,1974,1973,1972,1971,1970,1969,1968,1967,1966,1965,1964,1963,1962
Estas estatísticas em outros países:
AfghanistanAlbaniaAlgeriaArab WorldArgentinaArmeniaArubaAustraliaAustriaAzerbaijanBahamas, TheBahrainBangladeshBarbadosBelarusBelgiumBelizeBeninBermudaBoliviaBrazilBrunei DarussalamBulgariaBurkina FasoBurundiCabo VerdeCambodiaCameroonCanadaCaribbean small statesCentral African RepublicCentral Europe and the BalticsChileChinaColombiaCongo, Rep.Costa RicaCote d'IvoireCroatiaCyprusCzech RepublicDenmarkDominicaDominican RepublicEarly-demographic dividendEast Asia & PacificEast Asia & Pacific (excluding high income)East Asia & Pacific (IDA & IBRD countries)EcuadorEgypt, Arab Rep.El SalvadorEstoniaEthiopiaEuro areaEurope & Central AsiaEurope & Central Asia (excluding high income)Europe & Central Asia (IDA & IBRD countries)European UnionFijiFinlandFragile and conflict affected situationsFranceFrench PolynesiaGabonGambia, TheGeorgiaGermanyGhanaGreeceGreenlandGrenadaGuatemalaHaitiHeavily indebted poor countries (HIPC)High incomeHondurasHong Kong SAR, ChinaHungaryIBRD onlyIcelandIDA & IBRD totalIDA blendIDA onlyIDA totalIndiaIndonesiaIran, Islamic Rep.IraqIrelandIsraelItalyJamaicaJapanJordanKazakhstanKenyaKorea, Dem. People’s Rep.Korea, Rep.KuwaitKyrgyz RepublicLao PDRLate-demographic dividendLatin America & Caribbean Latin America & Caribbean (excluding high income)Latin America & the Caribbean (IDA & IBRD countries)LatviaLeast developed countries: UN classificationLebanonLithuaniaLow & middle incomeLow incomeLower middle incomeLuxembourgMacao SAR, ChinaMacedonia, FYRMadagascarMalaysiaMaliMaltaMauritiusMexicoMiddle East & North AfricaMiddle East & North Africa (excluding high income)Middle East & North Africa (IDA & IBRD countries)Middle incomeMoldovaMongoliaMontenegroMoroccoMyanmarNetherlandsNew CaledoniaNew ZealandNicaraguaNigerNigeriaNorth AmericaNorwayOECD membersOmanOther small statesPacific island small statesPakistanPanamaPapua New GuineaParaguayPeruPhilippinesPolandPortugalPost-demographic dividendPre-demographic dividendQatarRomaniaRussian FederationSamoaSaudi ArabiaSenegalSerbiaSingaporeSlovak RepublicSloveniaSmall statesSolomon IslandsSomaliaSouth AfricaSouth AsiaSouth Asia (IDA & IBRD)SpainSri LankaSt. Kitts and NevisSt. LuciaSt. Vincent and the GrenadinesSub-Saharan Africa Sub-Saharan Africa (excluding high income)Sub-Saharan Africa (IDA & IBRD countries)SurinameSwedenSwitzerlandTanzaniaThailandTogoTongaTrinidad and TobagoTunisiaTurkeyUgandaUkraineUnited Arab EmiratesUnited KingdomUnited StatesUpper middle incomeUruguayVanuatuVenezuela, RBVietnamWorldYemen, Rep.ZambiaZimbabwe Linha do tempo:
Nesta escala de tempo está apresentado um gráfico de 1962 ano até 2015 ano Congo, Rep.. Dados de 1961 ano ausente. O número de observações reais por data: 54.
Fonte (nome):
Indicadores de desenvolvimento mundial
Fonte (organização):
World Bank staff estimates based data from International Monetary Fund's Direction of Trade database.
Categorias:
Private Sector, Trade
Foi atualizado:
23 abr 2017 ano
Indicadores de alterações dos valores ao longo dos anos
Máximo:
21.534
1 jan 2009 ano
Na data de observação
Valor
Mudança absoluta
A alteração em relação ao valor anterior
1 jan 1962 ano
0.0
0.0
0.0%
1 jan 1964 ano
0.327
+0.327
%
1 jan 1965 ano
0.155
-0.172
-52.48%
1 jan 1966 ano
1.548
+1.393
896.9%
1 jan 1967 ano
0.868
-0.68
-43.91%
1 jan 1968 ano
3.753
+2.885
332.22%
1 jan 1969 ano
2.031
-1.722
-45.89%
1 jan 1970 ano
1.921
-0.109
-5.38%
1 jan 1971 ano
1.994
+0.073
3.8%
1 jan 1972 ano
2.415
+0.421
21.1%
1 jan 1973 ano
3.564
+1.149
47.57%
1 jan 1974 ano
2.511
-1.053
-29.54%
1 jan 1975 ano
2.633
+0.121
4.83%
1 jan 1976 ano
3.476
+0.843
32.02%
1 jan 1977 ano
2.817
-0.659
-18.96%
1 jan 1978 ano
1.622
-1.195
-42.43%
1 jan 1979 ano
1.856
+0.234
14.46%
1 jan 1980 ano
1.544
-0.312
-16.8%
1 jan 1981 ano
1.009
-0.536
-34.68%
1 jan 1982 ano
1.248
+0.239
23.74%
1 jan 1983 ano
1.339
+0.091
7.31%
1 jan 1984 ano
0.075
-1.264
-94.39%
1 jan 1985 ano
2.543
+2.468
3.28 mil%
1 jan 1986 ano
2.335
-0.208
-8.16%
1 jan 1987 ano
1.335
-1.0
-42.82%
1 jan 1988 ano
0.757
-0.578
-43.28%
1 jan 1989 ano
1.442
+0.684
90.33%
1 jan 1990 ano
1.164
-0.278
-19.29%
1 jan 1991 ano
0.694
-0.469
-40.34%
1 jan 1992 ano
0.664
-0.03
-4.39%
1 jan 1993 ano
0.601
-0.063
-9.42%
1 jan 1994 ano
1.072
+0.47
78.25%
1 jan 1995 ano
0.811
-0.261
-24.32%
1 jan 1996 ano
0.835
+0.024
2.94%
1 jan 1997 ano
1.347
+0.513
61.4%
1 jan 1998 ano
3.355
+2.007
148.97%
1 jan 1999 ano
7.416
+4.061
121.08%
1 jan 2000 ano
4.121
-3.295
-44.43%
1 jan 2001 ano
3.948
-0.173
-4.19%
1 jan 2002 ano
3.854
-0.095
-2.4%
1 jan 2003 ano
6.537
+2.683
69.62%
1 jan 2004 ano
4.213
-2.324
-35.55%
1 jan 2005 ano
7.584
+3.371
80.01%
1 jan 2006 ano
13.239
+5.655
74.56%
1 jan 2007 ano
16.515
+3.277
24.75%
1 jan 2008 ano
15.093
-1.423
-8.61%
1 jan 2009 ano
21.534
+6.441
42.68%
1 jan 2010 ano
15.258
-6.276
-29.15%
1 jan 2011 ano
16.776
+1.518
9.95%
1 jan 2012 ano
18.252
+1.477
8.8%
1 jan 2013 ano
18.262
+0.009
0.05%
1 jan 2014 ano
9.879
-8.383
-45.9%
1 jan 2015 ano
12.54
+2.66
26.93%
Classificação de países por estatísticas atuais por anos


Comentários: