29
/pt/
pt
AIzaSyAYiBZKx7MnpbEhh9jyipgxe19OcubqV5w
April 1, 2024
280046
Vanuatu
VUT
true
2
1
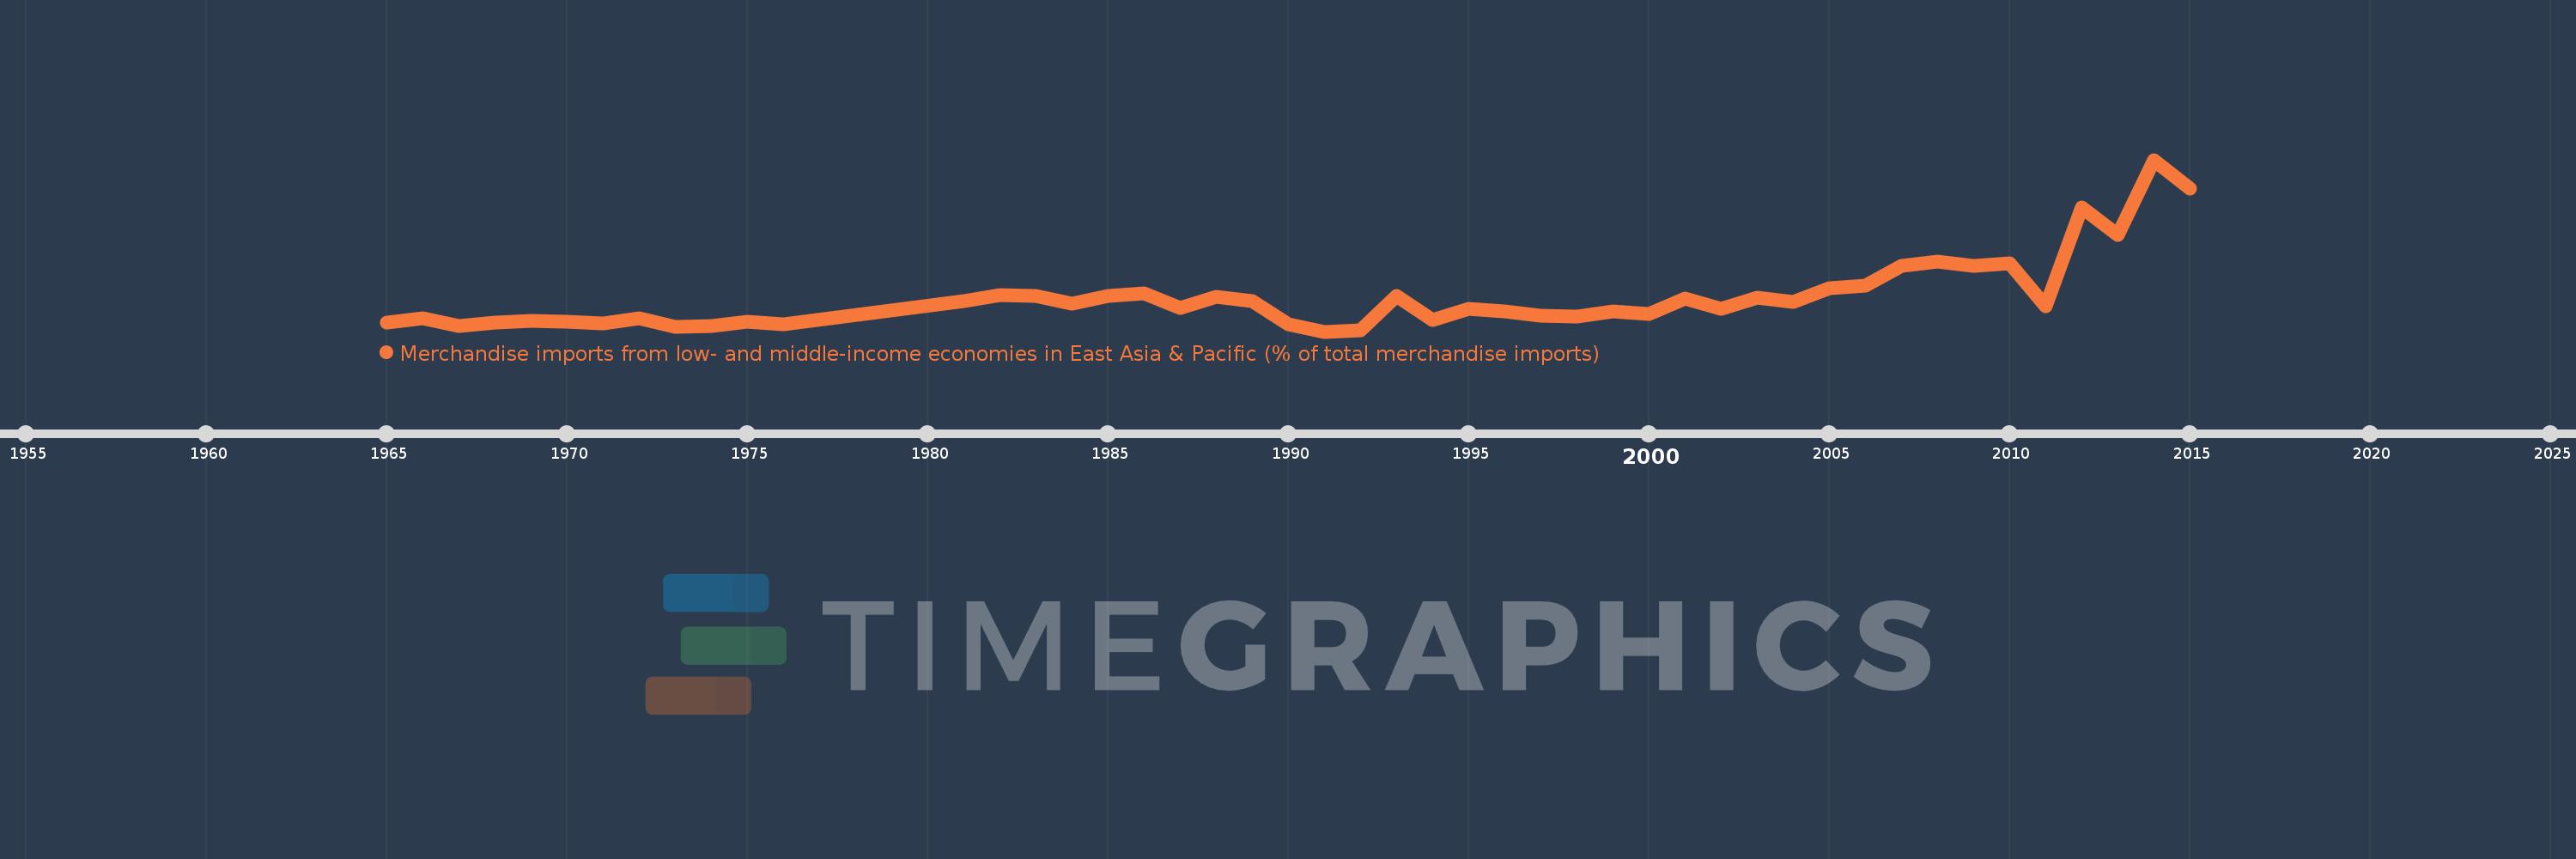
Merchandise imports from low- and middle-income economies in East Asia & Pacific (% of total merchandise imports)
2015,2014,2013,2012,2011,2010,2009,2008,2007,2006,2005,2004,2003,2002,2001,2000,1999,1998,1997,1996,1995,1994,1993,1992,1991,1990,1989,1988,1987,1986,1985,1984,1983,1982,1981,1976,1975,1974,1973,1972,1971,1970,1969,1968,1967,1966,1965
Estas estatísticas em outros países:
AfghanistanAlbaniaAlgeriaArab WorldArgentinaArmeniaArubaAustraliaAustriaAzerbaijanBahamas, TheBahrainBangladeshBarbadosBelarusBelgiumBelizeBeninBermudaBoliviaBrazilBrunei DarussalamBulgariaBurkina FasoBurundiCabo VerdeCambodiaCameroonCanadaCaribbean small statesCentral African RepublicCentral Europe and the BalticsChileChinaColombiaCongo, Rep.Costa RicaCote d'IvoireCroatiaCyprusCzech RepublicDenmarkDominicaDominican RepublicEarly-demographic dividendEast Asia & PacificEast Asia & Pacific (excluding high income)East Asia & Pacific (IDA & IBRD countries)EcuadorEgypt, Arab Rep.El SalvadorEstoniaEthiopiaEuro areaEurope & Central AsiaEurope & Central Asia (excluding high income)Europe & Central Asia (IDA & IBRD countries)European UnionFijiFinlandFragile and conflict affected situationsFranceFrench PolynesiaGabonGambia, TheGeorgiaGermanyGhanaGreeceGreenlandGrenadaGuatemalaHaitiHeavily indebted poor countries (HIPC)High incomeHondurasHong Kong SAR, ChinaHungaryIBRD onlyIcelandIDA & IBRD totalIDA blendIDA onlyIDA totalIndiaIndonesiaIran, Islamic Rep.IraqIrelandIsraelItalyJamaicaJapanJordanKazakhstanKenyaKorea, Dem. People’s Rep.Korea, Rep.KuwaitKyrgyz RepublicLao PDRLate-demographic dividendLatin America & Caribbean Latin America & Caribbean (excluding high income)Latin America & the Caribbean (IDA & IBRD countries)LatviaLeast developed countries: UN classificationLebanonLithuaniaLow & middle incomeLow incomeLower middle incomeLuxembourgMacao SAR, ChinaMacedonia, FYRMadagascarMalaysiaMaliMaltaMauritiusMexicoMiddle East & North AfricaMiddle East & North Africa (excluding high income)Middle East & North Africa (IDA & IBRD countries)Middle incomeMoldovaMongoliaMontenegroMoroccoMyanmarNetherlandsNew CaledoniaNew ZealandNicaraguaNigerNigeriaNorth AmericaNorwayOECD membersOmanOther small statesPacific island small statesPakistanPanamaPapua New GuineaParaguayPeruPhilippinesPolandPortugalPost-demographic dividendPre-demographic dividendQatarRomaniaRussian FederationSamoaSaudi ArabiaSenegalSerbiaSingaporeSlovak RepublicSloveniaSmall statesSolomon IslandsSomaliaSouth AfricaSouth AsiaSouth Asia (IDA & IBRD)SpainSri LankaSt. Kitts and NevisSt. LuciaSt. Vincent and the GrenadinesSub-Saharan Africa Sub-Saharan Africa (excluding high income)Sub-Saharan Africa (IDA & IBRD countries)SurinameSwedenSwitzerlandTanzaniaThailandTogoTongaTrinidad and TobagoTunisiaTurkeyUgandaUkraineUnited Arab EmiratesUnited KingdomUnited StatesUpper middle incomeUruguayVanuatuVenezuela, RBVietnamWorldYemen, Rep.ZambiaZimbabwe Linha do tempo:
Nesta escala de tempo está apresentado um gráfico de 1965 ano até 2015 ano Vanuatu. Dados de 1964 ano ausente. O número de observações reais por data: 47.
Fonte (nome):
Indicadores de desenvolvimento mundial
Fonte (organização):
World Bank staff estimates based data from International Monetary Fund's Direction of Trade database.
Categorias:
Private Sector, Trade
Foi atualizado:
23 abr 2017 ano
Indicadores de alterações dos valores ao longo dos anos
Mínimo:
1.006
1 jan 1991 ano
Máximo:
52.852
1 jan 2014 ano
Na data de observação
Valor
Mudança absoluta
A alteração em relação ao valor anterior
1 jan 1965 ano
3.691
+3.691
0.0%
1 jan 1966 ano
5.055
+1.364
36.95%
1 jan 1967 ano
2.623
-2.432
-48.12%
1 jan 1968 ano
3.819
+1.197
45.64%
1 jan 1969 ano
4.151
+0.332
8.69%
1 jan 1970 ano
3.935
-0.217
-5.22%
1 jan 1971 ano
3.422
-0.513
-13.03%
1 jan 1972 ano
5.052
+1.631
47.66%
1 jan 1973 ano
2.551
-2.502
-49.51%
1 jan 1974 ano
2.749
+0.198
7.77%
1 jan 1975 ano
3.92
+1.171
42.6%
1 jan 1976 ano
3.287
-0.633
-16.14%
1 jan 1981 ano
10.089
+6.802
206.91%
1 jan 1982 ano
11.907
+1.818
18.02%
1 jan 1983 ano
11.745
-0.162
-1.36%
1 jan 1984 ano
9.409
-2.336
-19.89%
1 jan 1985 ano
11.79
+2.381
25.31%
1 jan 1986 ano
12.451
+0.661
5.61%
1 jan 1987 ano
8.095
-4.356
-34.99%
1 jan 1988 ano
11.409
+3.315
40.95%
1 jan 1989 ano
10.331
-1.078
-9.45%
1 jan 1990 ano
3.303
-7.029
-68.03%
1 jan 1991 ano
1.006
-2.296
-69.54%
1 jan 1992 ano
1.353
+0.347
34.48%
1 jan 1993 ano
11.651
+10.298
761.16%
1 jan 1994 ano
4.387
-7.264
-62.35%
1 jan 1995 ano
7.922
+3.535
80.59%
1 jan 1996 ano
7.17
-0.752
-9.49%
1 jan 1997 ano
5.81
-1.361
-18.98%
1 jan 1998 ano
5.633
-0.177
-3.04%
1 jan 1999 ano
7.093
+1.46
25.93%
1 jan 2000 ano
6.236
-0.858
-12.09%
1 jan 2001 ano
10.943
+4.707
75.49%
1 jan 2002 ano
7.931
-3.012
-27.53%
1 jan 2003 ano
11.133
+3.203
40.38%
1 jan 2004 ano
9.971
-1.163
-10.44%
1 jan 2005 ano
14.156
+4.186
41.98%
1 jan 2006 ano
14.807
+0.651
4.6%
1 jan 2007 ano
20.867
+6.06
40.92%
1 jan 2008 ano
22.061
+1.194
5.72%
1 jan 2009 ano
20.803
-1.259
-5.7%
1 jan 2010 ano
21.498
+0.696
3.34%
1 jan 2011 ano
8.532
-12.967
-60.31%
1 jan 2012 ano
38.458
+29.926
350.76%
1 jan 2013 ano
30.064
-8.394
-21.83%
1 jan 2014 ano
52.852
+22.788
75.8%
1 jan 2015 ano
44.223
-8.629
-16.33%
Classificação de países por estatísticas atuais por anos


Comentários: