29
/pt/
pt
AIzaSyAYiBZKx7MnpbEhh9jyipgxe19OcubqV5w
April 1, 2024
36772
IBRD only
IBD
false
2
1
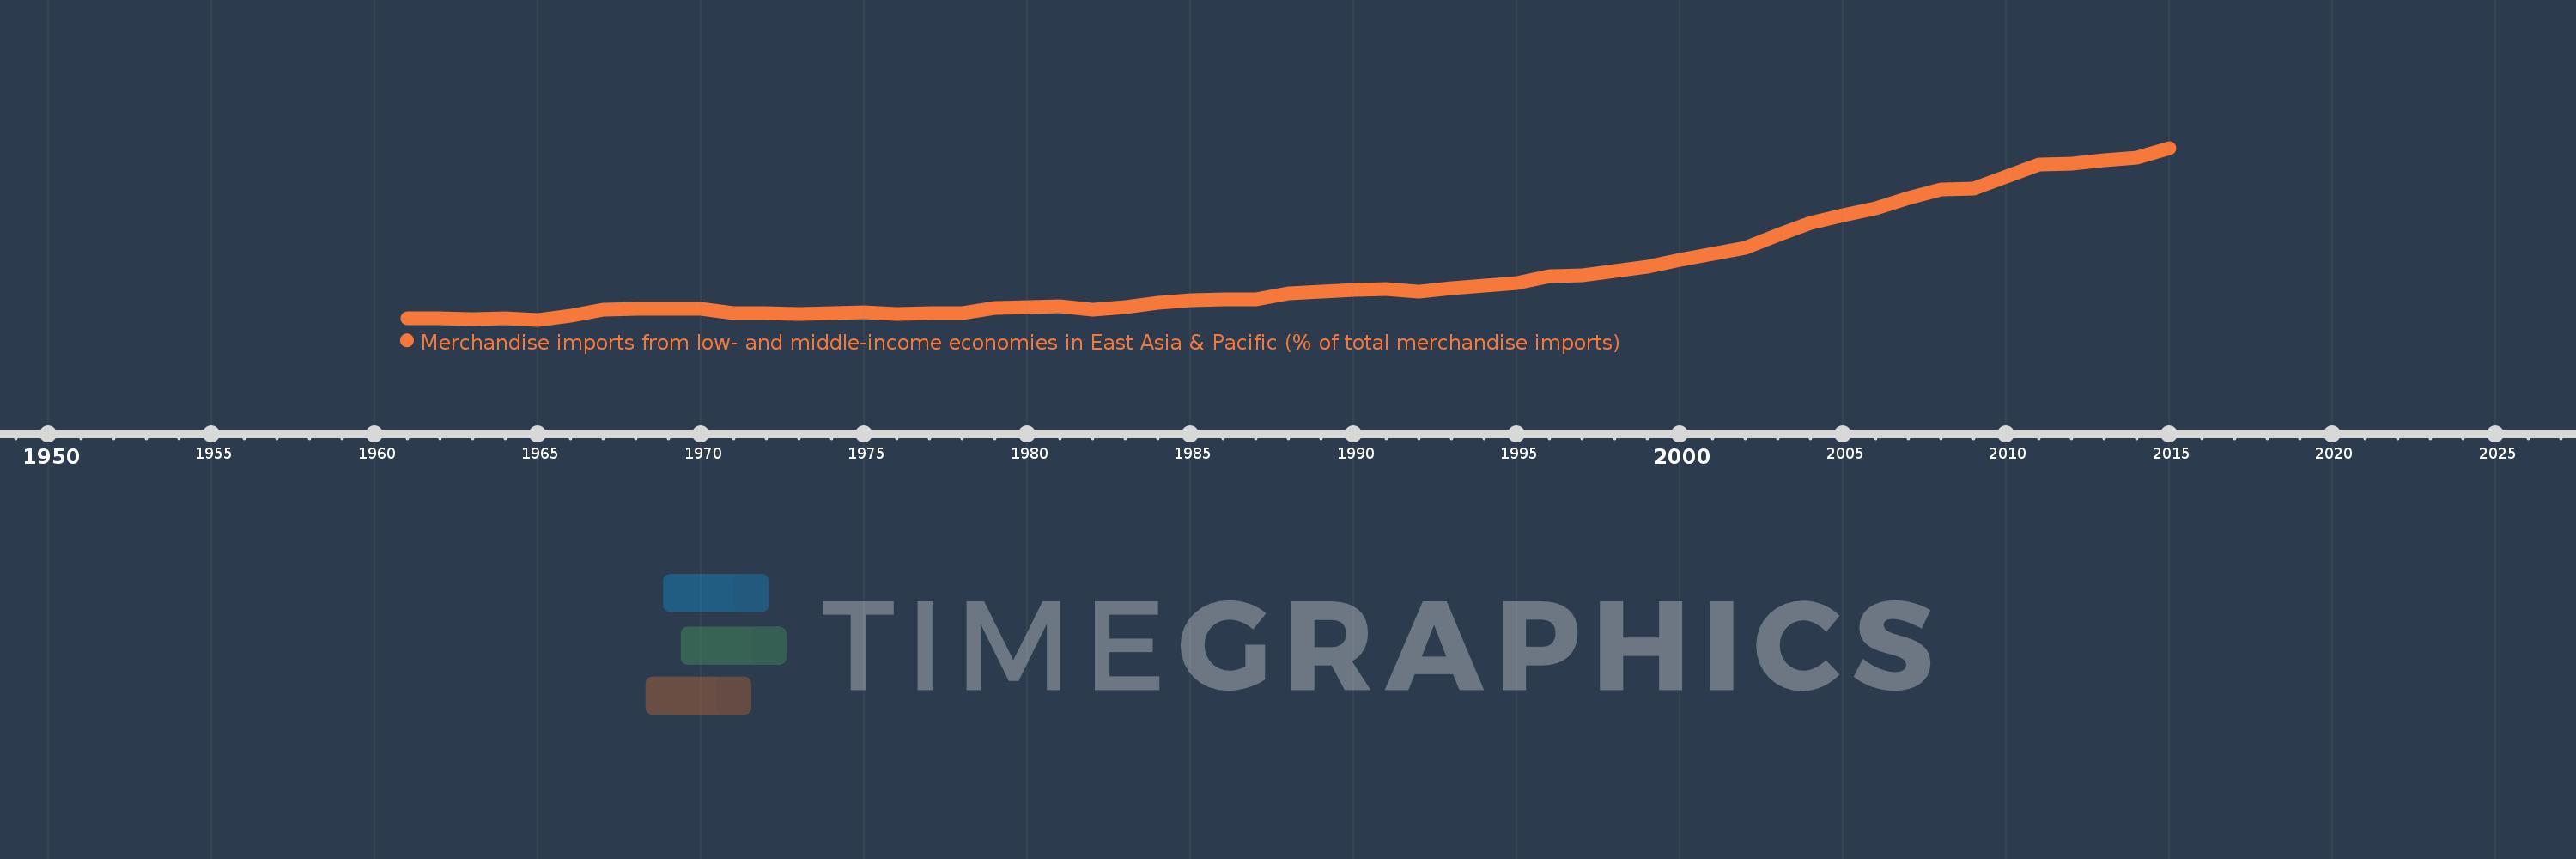
Merchandise imports from low- and middle-income economies in East Asia & Pacific (% of total merchandise imports)
2015,2014,2013,2012,2011,2010,2009,2008,2007,2006,2005,2004,2003,2002,2001,2000,1999,1998,1997,1996,1995,1994,1993,1992,1991,1990,1989,1988,1987,1986,1985,1984,1983,1982,1981,1980,1979,1978,1977,1976,1975,1974,1973,1972,1971,1970,1969,1968,1967,1966,1965,1964,1963,1962,1961
Estas estatísticas em outros países:
AfghanistanAlbaniaAlgeriaArab WorldArgentinaArmeniaArubaAustraliaAustriaAzerbaijanBahamas, TheBahrainBangladeshBarbadosBelarusBelgiumBelizeBeninBermudaBoliviaBrazilBrunei DarussalamBulgariaBurkina FasoBurundiCabo VerdeCambodiaCameroonCanadaCaribbean small statesCentral African RepublicCentral Europe and the BalticsChileChinaColombiaCongo, Rep.Costa RicaCote d'IvoireCroatiaCyprusCzech RepublicDenmarkDominicaDominican RepublicEarly-demographic dividendEast Asia & PacificEast Asia & Pacific (excluding high income)East Asia & Pacific (IDA & IBRD countries)EcuadorEgypt, Arab Rep.El SalvadorEstoniaEthiopiaEuro areaEurope & Central AsiaEurope & Central Asia (excluding high income)Europe & Central Asia (IDA & IBRD countries)European UnionFijiFinlandFragile and conflict affected situationsFranceFrench PolynesiaGabonGambia, TheGeorgiaGermanyGhanaGreeceGreenlandGrenadaGuatemalaHaitiHeavily indebted poor countries (HIPC)High incomeHondurasHong Kong SAR, ChinaHungaryIBRD onlyIcelandIDA & IBRD totalIDA blendIDA onlyIDA totalIndiaIndonesiaIran, Islamic Rep.IraqIrelandIsraelItalyJamaicaJapanJordanKazakhstanKenyaKorea, Dem. People’s Rep.Korea, Rep.KuwaitKyrgyz RepublicLao PDRLate-demographic dividendLatin America & Caribbean Latin America & Caribbean (excluding high income)Latin America & the Caribbean (IDA & IBRD countries)LatviaLeast developed countries: UN classificationLebanonLithuaniaLow & middle incomeLow incomeLower middle incomeLuxembourgMacao SAR, ChinaMacedonia, FYRMadagascarMalaysiaMaliMaltaMauritiusMexicoMiddle East & North AfricaMiddle East & North Africa (excluding high income)Middle East & North Africa (IDA & IBRD countries)Middle incomeMoldovaMongoliaMontenegroMoroccoMyanmarNetherlandsNew CaledoniaNew ZealandNicaraguaNigerNigeriaNorth AmericaNorwayOECD membersOmanOther small statesPacific island small statesPakistanPanamaPapua New GuineaParaguayPeruPhilippinesPolandPortugalPost-demographic dividendPre-demographic dividendQatarRomaniaRussian FederationSamoaSaudi ArabiaSenegalSerbiaSingaporeSlovak RepublicSloveniaSmall statesSolomon IslandsSomaliaSouth AfricaSouth AsiaSouth Asia (IDA & IBRD)SpainSri LankaSt. Kitts and NevisSt. LuciaSt. Vincent and the GrenadinesSub-Saharan Africa Sub-Saharan Africa (excluding high income)Sub-Saharan Africa (IDA & IBRD countries)SurinameSwedenSwitzerlandTanzaniaThailandTogoTongaTrinidad and TobagoTunisiaTurkeyUgandaUkraineUnited Arab EmiratesUnited KingdomUnited StatesUpper middle incomeUruguayVanuatuVenezuela, RBVietnamWorldYemen, Rep.ZambiaZimbabwe Linha do tempo:
Nesta escala de tempo está apresentado um gráfico de 1961 ano até 2015 ano IBRD only. Dados de 1960 ano ausente. O número de observações reais por data: 55.
Fonte (nome):
Indicadores de desenvolvimento mundial
Fonte (organização):
World Bank staff estimates based data from International Monetary Fund's Direction of Trade database.
Categorias:
Private Sector, Trade
Foi atualizado:
23 abr 2017 ano
Indicadores de alterações dos valores ao longo dos anos
Mínimo:
0.867
1 jan 1965 ano
Máximo:
15.998
1 jan 2015 ano
Na data de observação
Valor
Mudança absoluta
A alteração em relação ao valor anterior
1 jan 1961 ano
1.016
+1.016
0.0%
1 jan 1962 ano
1.021
+0.005
0.51%
1 jan 1963 ano
0.908
-0.113
-11.05%
1 jan 1964 ano
0.996
+0.088
9.67%
1 jan 1965 ano
0.867
-0.129
-12.97%
1 jan 1966 ano
1.201
+0.334
38.54%
1 jan 1967 ano
1.73
+0.53
44.11%
1 jan 1968 ano
1.849
+0.118
6.84%
1 jan 1969 ano
1.855
+0.006
0.34%
1 jan 1970 ano
1.792
-0.064
-3.43%
1 jan 1971 ano
1.437
-0.354
-19.79%
1 jan 1972 ano
1.478
+0.041
2.88%
1 jan 1973 ano
1.408
-0.071
-4.78%
1 jan 1974 ano
1.413
+0.005
0.36%
1 jan 1975 ano
1.505
+0.092
6.53%
1 jan 1976 ano
1.384
-0.121
-8.03%
1 jan 1977 ano
1.426
+0.041
2.99%
1 jan 1978 ano
1.432
+0.006
0.41%
1 jan 1979 ano
1.879
+0.448
31.27%
1 jan 1980 ano
1.972
+0.093
4.94%
1 jan 1981 ano
2.018
+0.046
2.33%
1 jan 1982 ano
1.748
-0.27
-13.38%
1 jan 1983 ano
2.014
+0.266
15.24%
1 jan 1984 ano
2.36
+0.346
17.15%
1 jan 1985 ano
2.594
+0.234
9.9%
1 jan 1986 ano
2.623
+0.03
1.14%
1 jan 1987 ano
2.658
+0.035
1.32%
1 jan 1988 ano
3.21
+0.552
20.77%
1 jan 1989 ano
3.311
+0.101
3.14%
1 jan 1990 ano
3.498
+0.187
5.65%
1 jan 1991 ano
3.551
+0.054
1.53%
1 jan 1992 ano
3.333
-0.218
-6.13%
1 jan 1993 ano
3.631
+0.298
8.93%
1 jan 1994 ano
3.858
+0.227
6.24%
1 jan 1995 ano
4.08
+0.223
5.77%
1 jan 1996 ano
4.732
+0.651
15.96%
1 jan 1997 ano
4.815
+0.083
1.76%
1 jan 1998 ano
5.164
+0.348
7.24%
1 jan 1999 ano
5.519
+0.356
6.89%
1 jan 2000 ano
6.116
+0.597
10.82%
1 jan 2001 ano
6.683
+0.567
9.28%
1 jan 2002 ano
7.193
+0.509
7.62%
1 jan 2003 ano
8.33
+1.137
15.8%
1 jan 2004 ano
9.416
+1.086
13.04%
1 jan 2005 ano
10.039
+0.623
6.61%
1 jan 2006 ano
10.68
+0.642
6.39%
1 jan 2007 ano
11.62
+0.939
8.79%
1 jan 2008 ano
12.379
+0.76
6.54%
1 jan 2009 ano
12.452
+0.073
0.59%
1 jan 2010 ano
13.478
+1.026
8.24%
1 jan 2011 ano
14.518
+1.04
7.71%
1 jan 2012 ano
14.644
+0.126
0.87%
1 jan 2013 ano
14.911
+0.267
1.83%
1 jan 2014 ano
15.177
+0.266
1.78%
1 jan 2015 ano
15.998
+0.82
5.41%
Classificação de países por estatísticas atuais por anos


Comentários: