29
/pt/
pt
AIzaSyAYiBZKx7MnpbEhh9jyipgxe19OcubqV5w
April 1, 2024
47749
Lower middle income
LMC
false
2
1
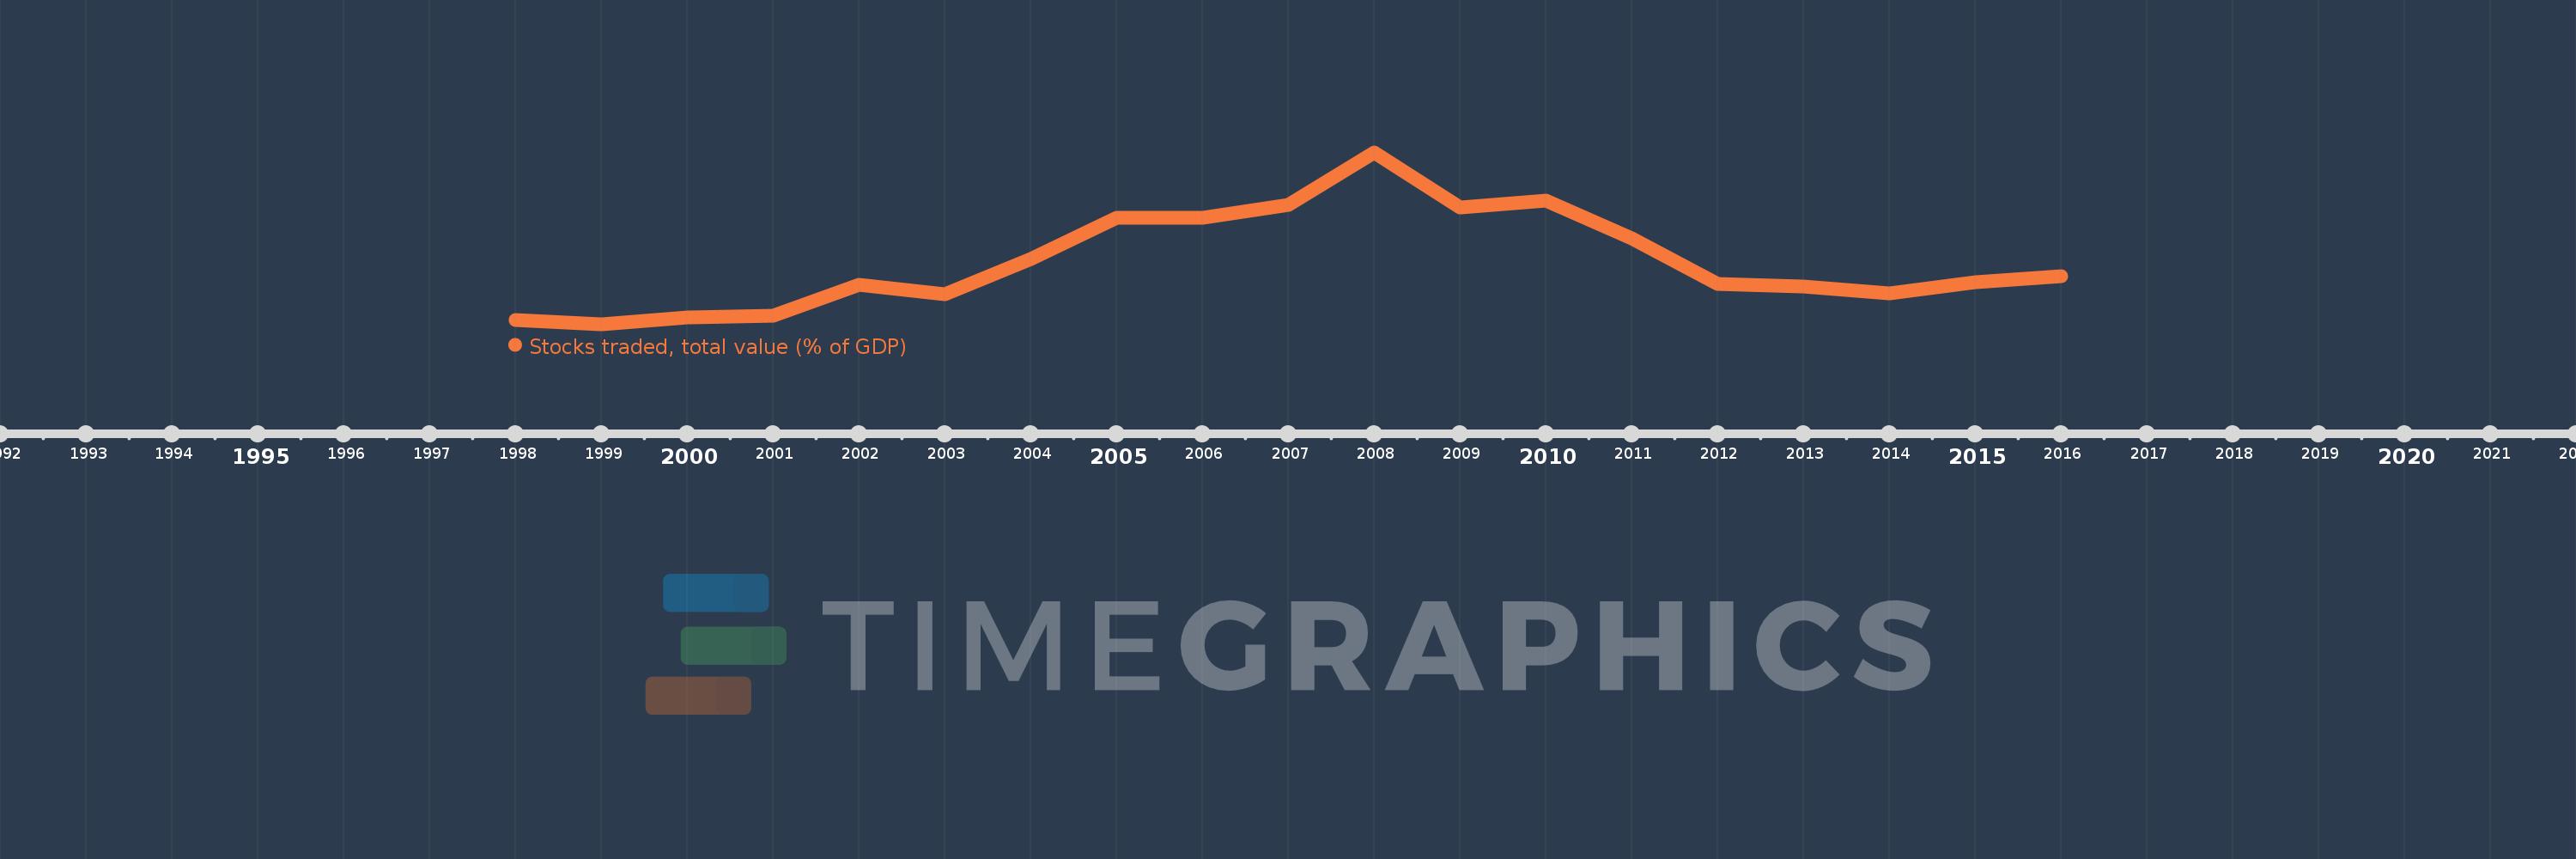
Stocks traded, total value (% of GDP)
2016,2015,2014,2013,2012,2011,2010,2009,2008,2007,2006,2005,2004,2003,2002,2001,2000,1999,1998
Estas estatísticas em outros países:
Linha do tempo:
Nesta escala de tempo está apresentado um gráfico de 1998 ano até 2016 ano Lower middle income. Dados de 1997 ano ausente. O número de observações reais por data: 19.
Fonte (nome):
Indicadores de desenvolvimento mundial
Fonte (organização):
World Federation of Exchanges database.
Categorias:
Financial Sector
Foi atualizado:
23 abr 2017 ano
Indicadores de alterações dos valores ao longo dos anos
Mínimo:
5.313
1 jan 1999 ano
Máximo:
57.386
1 jan 2008 ano
Na data de observação
Valor
Mudança absoluta
A alteração em relação ao valor anterior
1 jan 1998 ano
6.515
+6.515
0.0%
1 jan 1999 ano
5.313
-1.202
-18.45%
1 jan 2000 ano
7.281
+1.968
37.04%
1 jan 2001 ano
7.924
+0.644
8.84%
1 jan 2002 ano
17.287
+9.362
118.14%
1 jan 2003 ano
14.494
-2.792
-16.15%
1 jan 2004 ano
25.035
+10.541
72.73%
1 jan 2005 ano
37.549
+12.514
49.98%
1 jan 2006 ano
37.695
+0.147
0.39%
1 jan 2007 ano
41.491
+3.796
10.07%
1 jan 2008 ano
57.386
+15.894
38.31%
1 jan 2009 ano
40.688
-16.698
-29.1%
1 jan 2010 ano
42.672
+1.984
4.88%
1 jan 2011 ano
31.28
-11.393
-26.7%
1 jan 2012 ano
17.614
-13.666
-43.69%
1 jan 2013 ano
16.686
-0.927
-5.26%
1 jan 2014 ano
14.532
-2.154
-12.91%
1 jan 2015 ano
18.104
+3.572
24.58%
1 jan 2016 ano
19.85
+1.746
9.65%
Classificação de países por estatísticas atuais por anos


Comentários: