29
/pt/
pt
AIzaSyAYiBZKx7MnpbEhh9jyipgxe19OcubqV5w
April 1, 2024
30315
Euro area
EMU
false
2
1
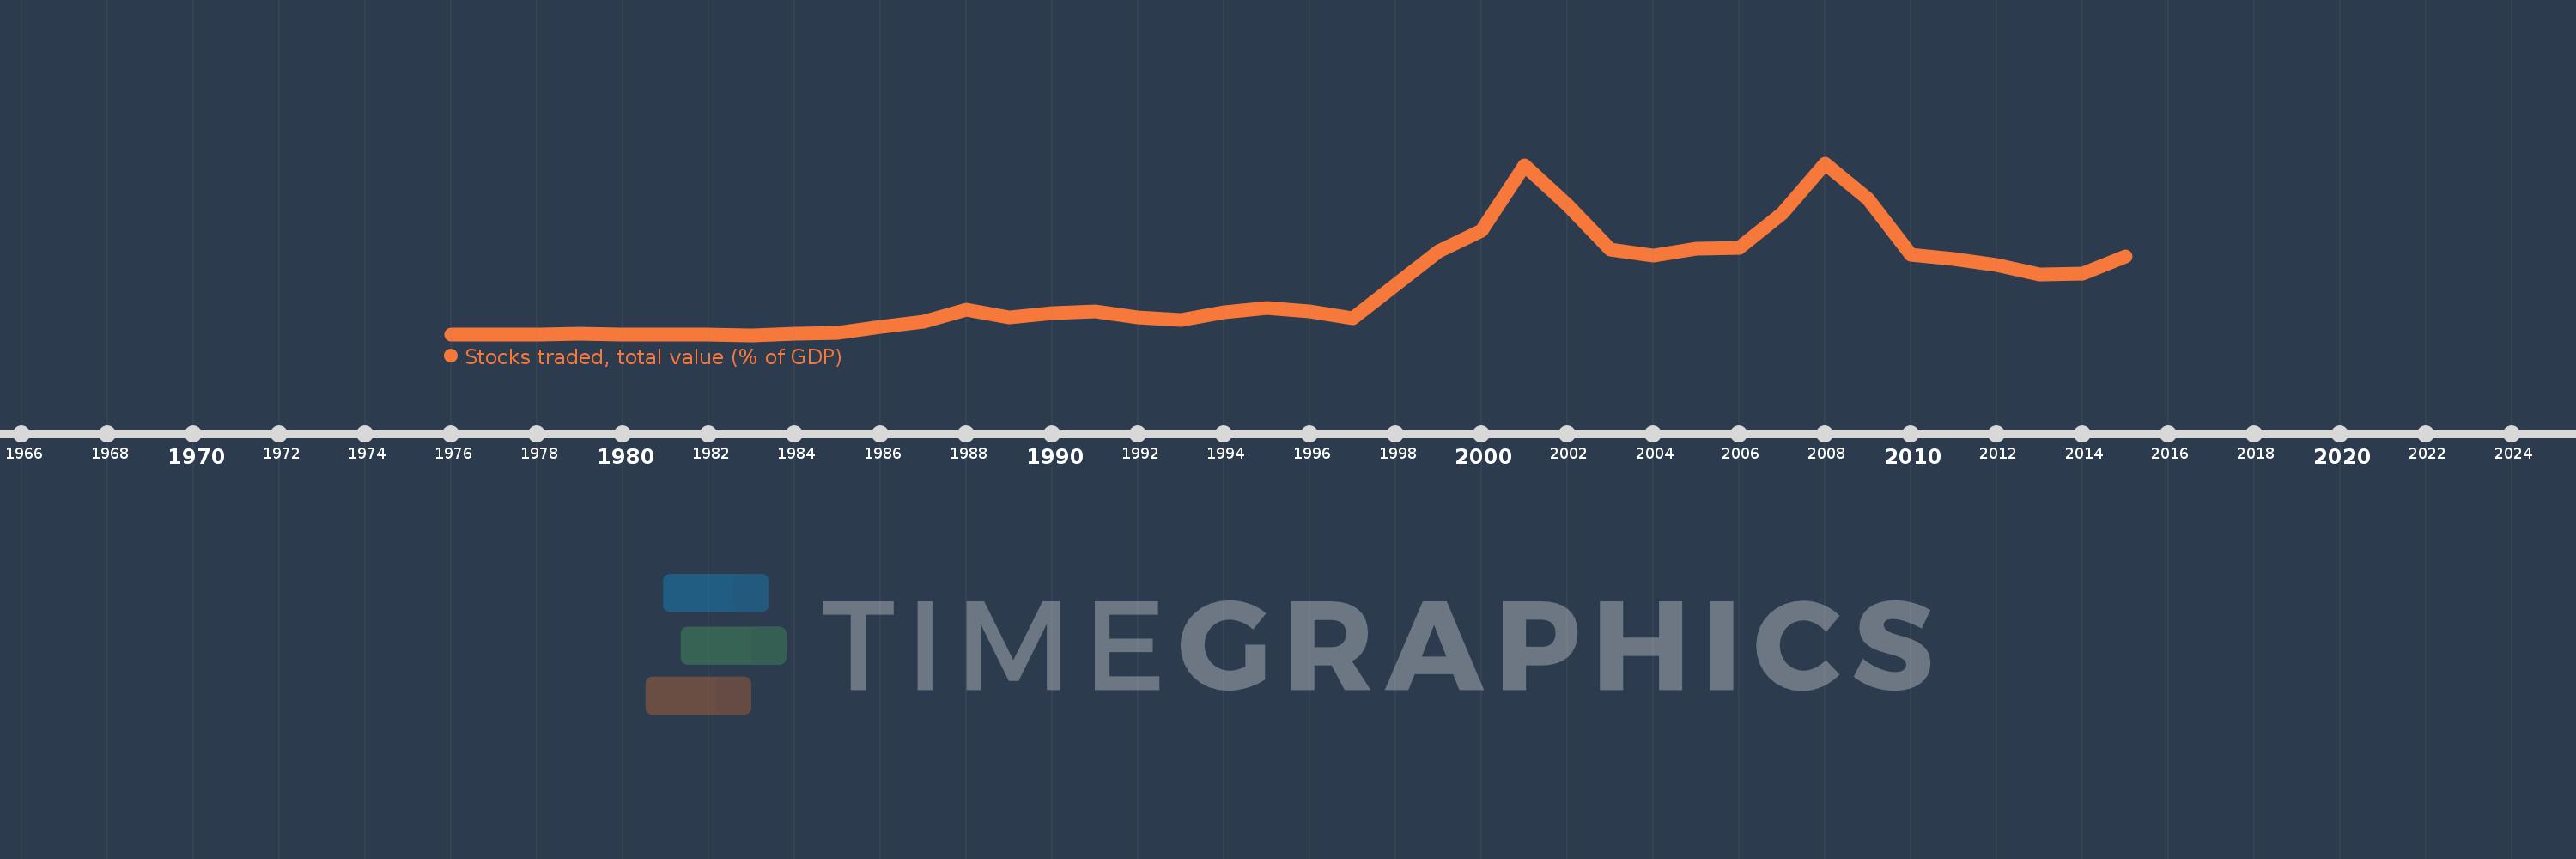
Stocks traded, total value (% of GDP)
2015,2014,2013,2012,2011,2010,2009,2008,2007,2006,2005,2004,2003,2002,2001,2000,1999,1998,1997,1996,1995,1994,1993,1992,1991,1990,1989,1988,1987,1986,1985,1984,1983,1982,1981,1980,1979,1978,1977,1976
Estas estatísticas em outros países:
Linha do tempo:
Nesta escala de tempo está apresentado um gráfico de 1976 ano até 2015 ano Euro area. Dados de 1975 ano ausente. O número de observações reais por data: 40.
Fonte (nome):
Indicadores de desenvolvimento mundial
Fonte (organização):
World Federation of Exchanges database.
Categorias:
Financial Sector
Foi atualizado:
23 abr 2017 ano
Indicadores de alterações dos valores ao longo dos anos
Mínimo:
1.337
1 jan 1983 ano
Máximo:
102.454
1 jan 2008 ano
Na data de observação
Valor
Mudança absoluta
A alteração em relação ao valor anterior
1 jan 1976 ano
1.789
+1.789
0.0%
1 jan 1977 ano
1.678
-0.11
-6.17%
1 jan 1978 ano
1.656
-0.023
-1.34%
1 jan 1979 ano
2.121
+0.465
28.09%
1 jan 1980 ano
1.404
-0.716
-33.79%
1 jan 1981 ano
1.383
-0.022
-1.54%
1 jan 1982 ano
1.598
+0.216
15.59%
1 jan 1983 ano
1.337
-0.262
-16.37%
1 jan 1984 ano
2.325
+0.988
73.94%
1 jan 1985 ano
2.358
+0.033
1.43%
1 jan 1986 ano
6.218
+3.859
163.66%
1 jan 1987 ano
9.298
+3.08
49.54%
1 jan 1988 ano
16.089
+6.791
73.04%
1 jan 1989 ano
11.643
-4.446
-27.63%
1 jan 1990 ano
14.0
+2.357
20.24%
1 jan 1991 ano
15.337
+1.336
9.55%
1 jan 1992 ano
11.777
-3.56
-23.21%
1 jan 1993 ano
10.359
-1.418
-12.04%
1 jan 1994 ano
14.557
+4.198
40.53%
1 jan 1995 ano
17.433
+2.876
19.75%
1 jan 1996 ano
15.095
-2.338
-13.41%
1 jan 1997 ano
11.39
-3.705
-24.54%
1 jan 1998 ano
31.119
+19.729
173.21%
1 jan 1999 ano
50.821
+19.701
63.31%
1 jan 2000 ano
62.709
+11.888
23.39%
1 jan 2001 ano
101.38
+38.671
61.67%
1 jan 2002 ano
78.181
-23.199
-22.88%
1 jan 2003 ano
51.687
-26.494
-33.89%
1 jan 2004 ano
48.275
-3.412
-6.6%
1 jan 2005 ano
51.926
+3.651
7.56%
1 jan 2006 ano
52.897
+0.971
1.87%
1 jan 2007 ano
73.058
+20.161
38.11%
1 jan 2008 ano
102.454
+29.397
40.24%
1 jan 2009 ano
81.228
-21.227
-20.72%
1 jan 2010 ano
48.615
-32.612
-40.15%
1 jan 2011 ano
46.315
-2.3
-4.73%
1 jan 2012 ano
42.3
-4.015
-8.67%
1 jan 2013 ano
37.146
-5.154
-12.18%
1 jan 2014 ano
37.433
+0.287
0.77%
1 jan 2015 ano
47.76
+10.327
27.59%
Classificação de países por estatísticas atuais por anos


Comentários: