30
/pt/
AIzaSyAYiBZKx7MnpbEhh9jyipgxe19OcubqV5w
April 1, 2024
37019
IBRD only
IBD
false
2
1
Stocks traded, total value (% of GDP)
2016,2015,2014,2013,2012,2011,2010,2009,2008,2007,2006,2005,2004,2003,2002,2001,2000,1999,1998,1997,1996,1995,1994
Download
Biblioteca de estatísticas globais →IBRD only →

Stocks traded, total value (% of GDP)

Estas estatísticas em outros países:

Arab WorldArgentinaArmeniaAustraliaAustriaBahrainBangladeshBarbadosBelgiumBermudaBoliviaBotswanaBrazilBulgariaCanadaCayman IslandsCentral Europe and the BalticsChannel IslandsChileChinaColombiaCosta RicaCote d'IvoireCroatiaCyprusCzech RepublicDenmarkEarly-demographic dividendEast Asia & PacificEast Asia & Pacific (excluding high income)East Asia & Pacific (IDA & IBRD countries)EcuadorEgypt, Arab Rep.El SalvadorEstoniaEuro areaEurope & Central AsiaEurope & Central Asia (excluding high income)Europe & Central Asia (IDA & IBRD countries)European UnionFijiFinlandFranceGeorgiaGermanyGhanaGreeceGuyanaHigh incomeHong Kong SAR, ChinaHungaryIBRD onlyIcelandIDA & IBRD totalIDA blendIDA totalIndiaIndonesiaIran, Islamic Rep.IrelandIsraelItalyJamaicaJapanJordanKazakhstanKenyaKorea, Rep.KuwaitKyrgyz RepublicLate-demographic dividendLatin America & Caribbean Latin America & Caribbean (excluding high income)Latin America & the Caribbean (IDA & IBRD countries)LatviaLebanonLithuaniaLow & middle incomeLower middle incomeLuxembourgMacedonia, FYRMalawiMalaysiaMaltaMauritiusMexicoMiddle East & North AfricaMiddle East & North Africa (excluding high income)Middle East & North Africa (IDA & IBRD countries)Middle incomeMoldovaMongoliaMontenegroMoroccoNamibiaNetherlandsNew ZealandNigeriaNorth AmericaNorwayOECD membersOmanOther small statesPakistanPanamaPapua New GuineaParaguayPeruPhilippinesPolandPortugalPost-demographic dividendQatarRomaniaRussian FederationSaudi ArabiaSerbiaSeychellesSingaporeSlovak RepublicSloveniaSouth AfricaSouth AsiaSouth Asia (IDA & IBRD)SpainSri LankaSt. Kitts and NevisSub-Saharan Africa Sub-Saharan Africa (excluding high income)Sub-Saharan Africa (IDA & IBRD countries)SwazilandSwedenSwitzerlandTanzaniaThailandTrinidad and TobagoTunisiaTurkeyUgandaUkraineUnited Arab EmiratesUnited KingdomUnited StatesUpper middle incomeUruguayUzbekistanVenezuela, RBVietnamWest Bank and GazaWorldZambiaZimbabwe

Linha do tempo:

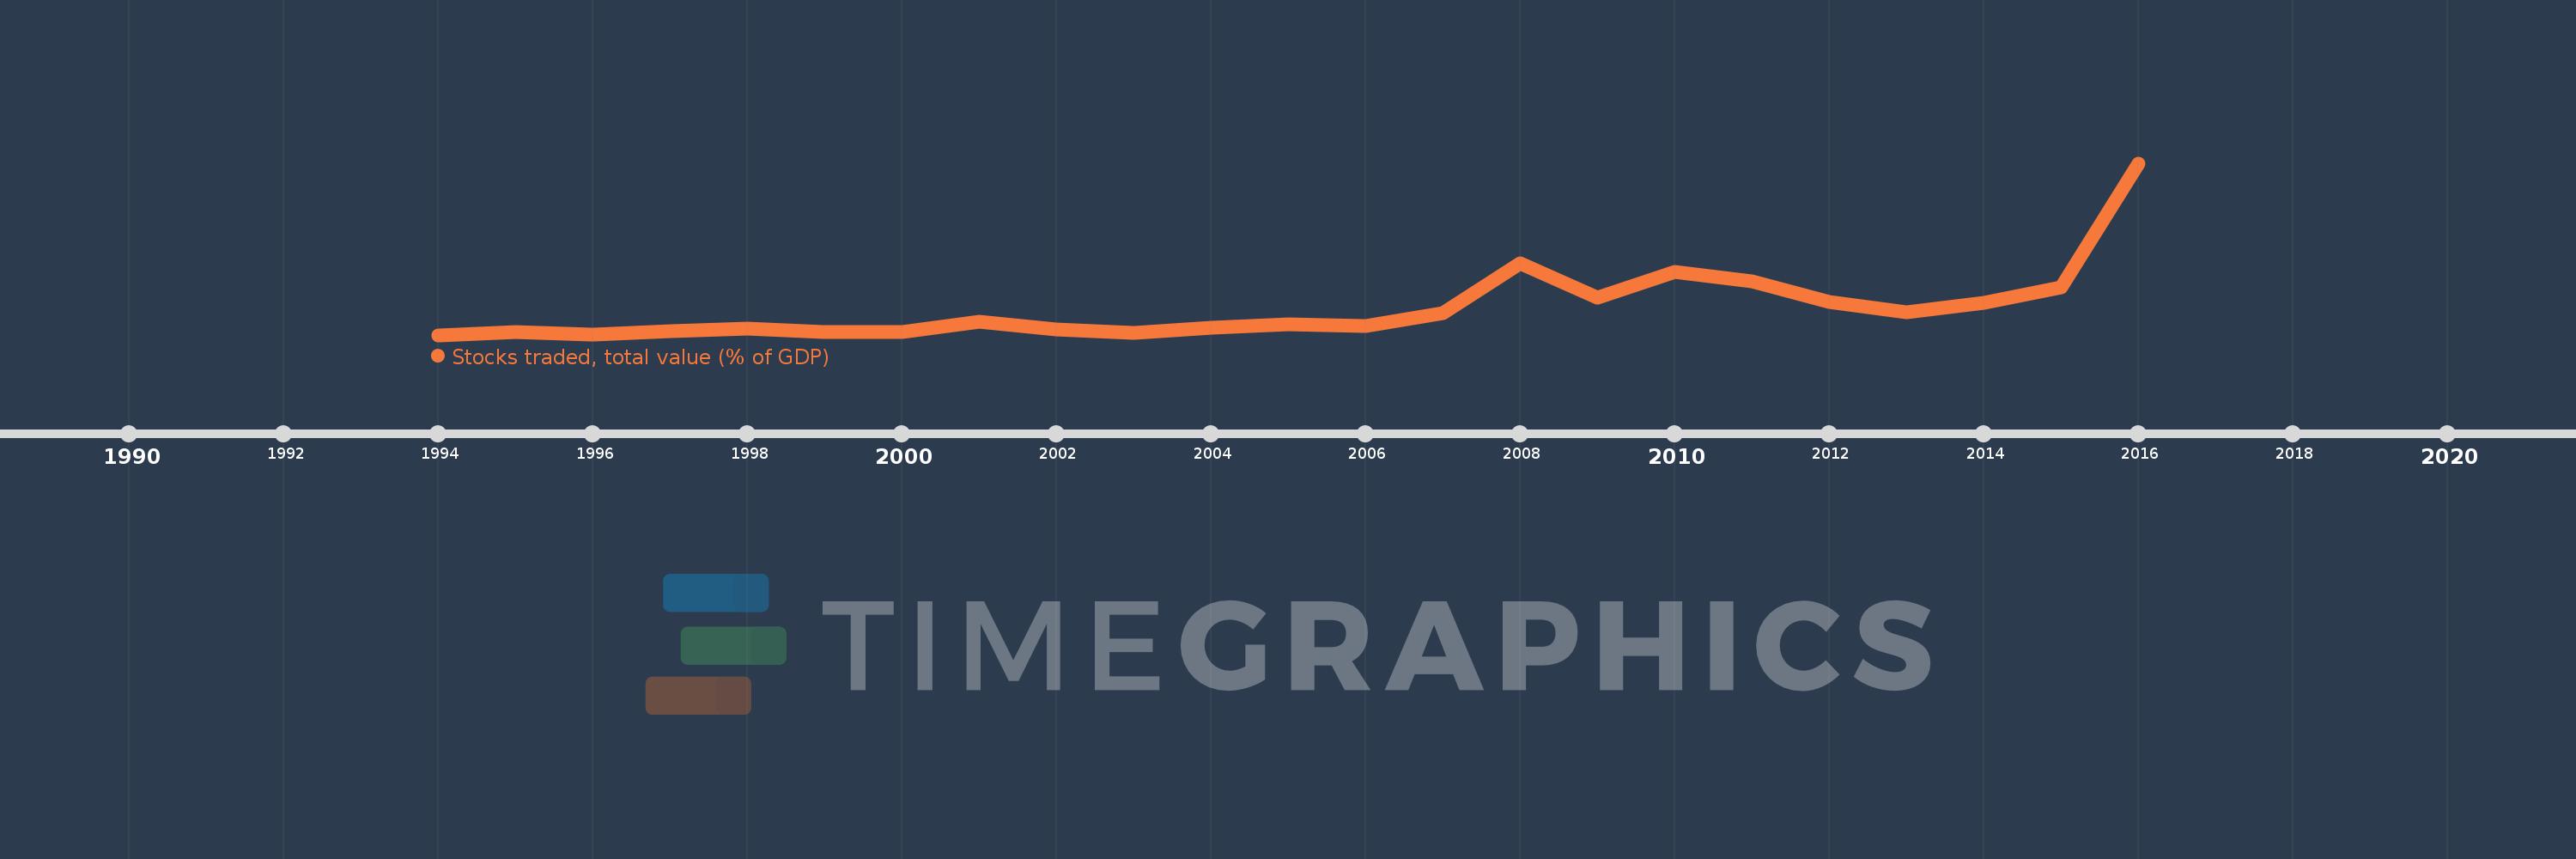
Nesta escala de tempo está apresentado um gráfico de 1994 ano até 2016 ano IBRD only. Dados de 1993 ano ausente. O número de observações reais por data: 23.

Fonte (nome):

Indicadores de desenvolvimento mundial

Fonte (organização):

World Federation of Exchanges database.

Categorias:

Financial Sector

Foi atualizado:

23 abr 2017 ano

Indicadores de alterações dos valores ao longo dos anos

Em média:
39.498
Mínimo:
12.222
1 jan 1994 ano
Máximo:
184.896
1 jan 2016 ano
Na data de observação
Valor
Mudança absoluta
A alteração em relação ao valor anterior
1 jan 1994 ano
12.222
+12.222
0.0%
1 jan 1995 ano
15.393
+3.171
25.94%
1 jan 1996 ano
12.459
-2.934
-19.06%
1 jan 1997 ano
16.311
+3.851
30.91%
1 jan 1998 ano
18.799
+2.489
15.26%
1 jan 1999 ano
15.201
-3.598
-19.14%
1 jan 2000 ano
14.97
-0.231
-1.52%
1 jan 2001 ano
25.677
+10.707
71.52%
1 jan 2002 ano
17.769
-7.908
-30.8%
1 jan 2003 ano
14.42
-3.349
-18.85%
1 jan 2004 ano
19.319
+4.899
33.97%
1 jan 2005 ano
23.051
+3.732
19.32%
1 jan 2006 ano
21.066
-1.985
-8.61%
1 jan 2007 ano
34.603
+13.538
64.26%
1 jan 2008 ano
84.134
+49.53
143.14%
1 jan 2009 ano
49.859
-34.275
-40.74%
1 jan 2010 ano
75.659
+25.801
51.75%
1 jan 2011 ano
66.61
-9.05
-11.96%
1 jan 2012 ano
45.882
-20.728
-31.12%
1 jan 2013 ano
35.49
-10.392
-22.65%
1 jan 2014 ano
44.406
+8.916
25.12%
1 jan 2015 ano
60.255
+15.849
35.69%
1 jan 2016 ano
184.896
+124.641
206.86%

Classificação de países por estatísticas atuais por anos