29
/pt/
pt
AIzaSyAYiBZKx7MnpbEhh9jyipgxe19OcubqV5w
April 1, 2024
182580
Luxembourg
LUX
true
2
1
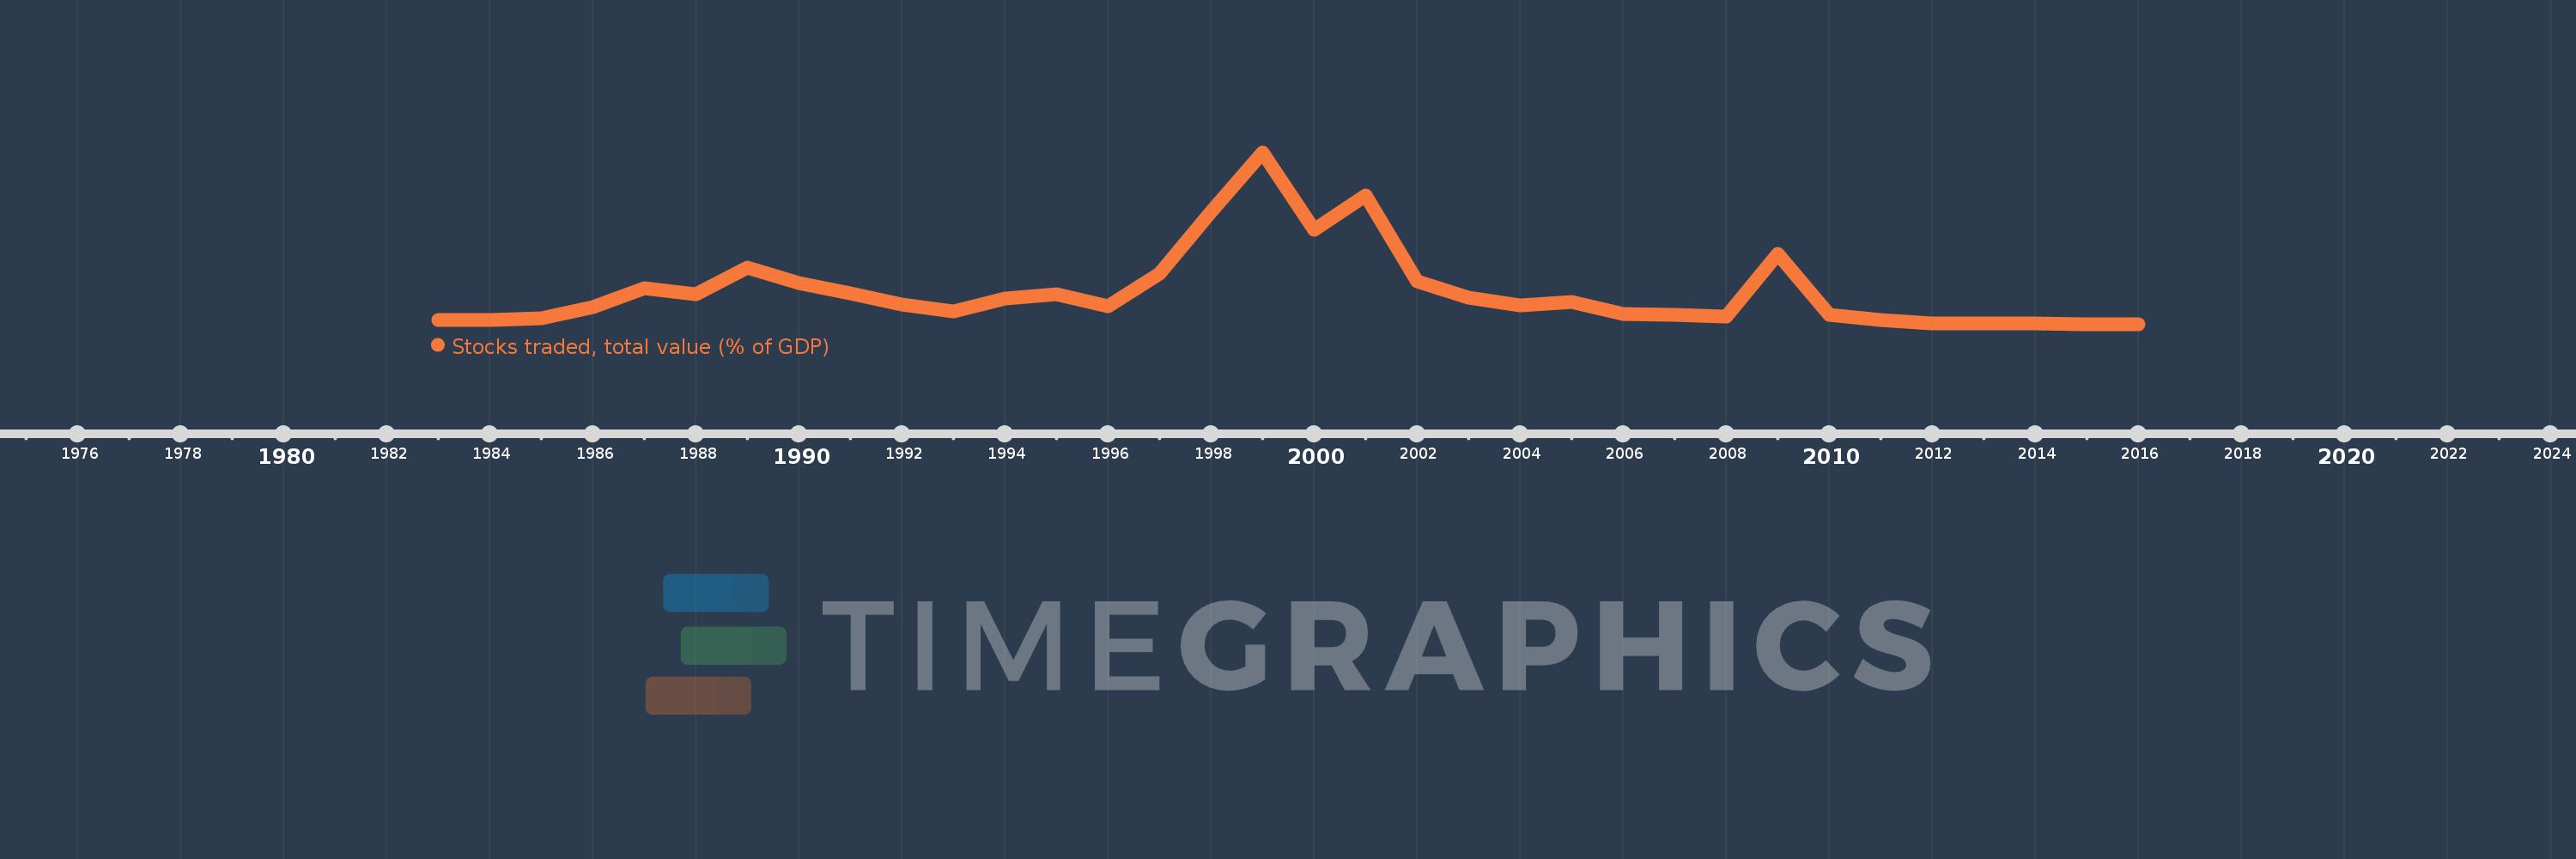
Stocks traded, total value (% of GDP)
2016,2015,2014,2013,2012,2011,2010,2009,2008,2007,2006,2005,2004,2003,2002,2001,2000,1999,1998,1997,1996,1995,1994,1993,1992,1991,1990,1989,1988,1987,1986,1985,1984,1983
Estas estatísticas em outros países:
Linha do tempo:
Nesta escala de tempo está apresentado um gráfico de 1983 ano até 2016 ano Luxembourg. Dados de 1982 ano ausente. O número de observações reais por data: 34.
Fonte (nome):
Indicadores de desenvolvimento mundial
Fonte (organização):
World Federation of Exchanges database.
Categorias:
Financial Sector
Foi atualizado:
23 abr 2017 ano
Indicadores de alterações dos valores ao longo dos anos
Mínimo:
0.166
1 jan 2016 ano
Máximo:
7.66
1 jan 1999 ano
Na data de observação
Valor
Mudança absoluta
A alteração em relação ao valor anterior
1 jan 1983 ano
0.358
+0.358
0.0%
1 jan 1984 ano
0.343
-0.015
-4.2%
1 jan 1985 ano
0.44
+0.097
28.23%
1 jan 1986 ano
0.894
+0.455
103.42%
1 jan 1987 ano
1.743
+0.849
94.96%
1 jan 1988 ano
1.46
-0.283
-16.22%
1 jan 1989 ano
2.624
+1.164
79.67%
1 jan 1990 ano
1.974
-0.65
-24.79%
1 jan 1991 ano
1.495
-0.478
-24.24%
1 jan 1992 ano
1.032
-0.463
-30.95%
1 jan 1993 ano
0.713
-0.32
-30.95%
1 jan 1994 ano
1.285
+0.572
80.23%
1 jan 1995 ano
1.471
+0.186
14.5%
1 jan 1996 ano
0.954
-0.517
-35.17%
1 jan 1997 ano
2.365
+1.411
147.94%
1 jan 1998 ano
5.055
+2.69
113.76%
1 jan 1999 ano
7.66
+2.605
51.54%
1 jan 2000 ano
4.284
-3.376
-44.07%
1 jan 2001 ano
5.799
+1.514
35.35%
1 jan 2002 ano
2.047
-3.752
-64.7%
1 jan 2003 ano
1.318
-0.729
-35.6%
1 jan 2004 ano
0.969
-0.349
-26.5%
1 jan 2005 ano
1.154
+0.185
19.14%
1 jan 2006 ano
0.613
-0.541
-46.9%
1 jan 2007 ano
0.573
-0.04
-6.46%
1 jan 2008 ano
0.485
-0.089
-15.45%
1 jan 2009 ano
3.247
+2.762
569.68%
1 jan 2010 ano
0.557
-2.69
-82.83%
1 jan 2011 ano
0.34
-0.218
-39.07%
1 jan 2012 ano
0.209
-0.131
-38.44%
1 jan 2013 ano
0.205
-0.004
-1.8%
1 jan 2014 ano
0.193
-0.012
-5.78%
1 jan 2015 ano
0.17
-0.023
-11.99%
1 jan 2016 ano
0.166
-0.004
-2.49%
Classificação de países por estatísticas atuais por anos


Comentários: