29
/pt/
pt
AIzaSyAYiBZKx7MnpbEhh9jyipgxe19OcubqV5w
April 1, 2024
139789
Germany
DEU
true
2
1
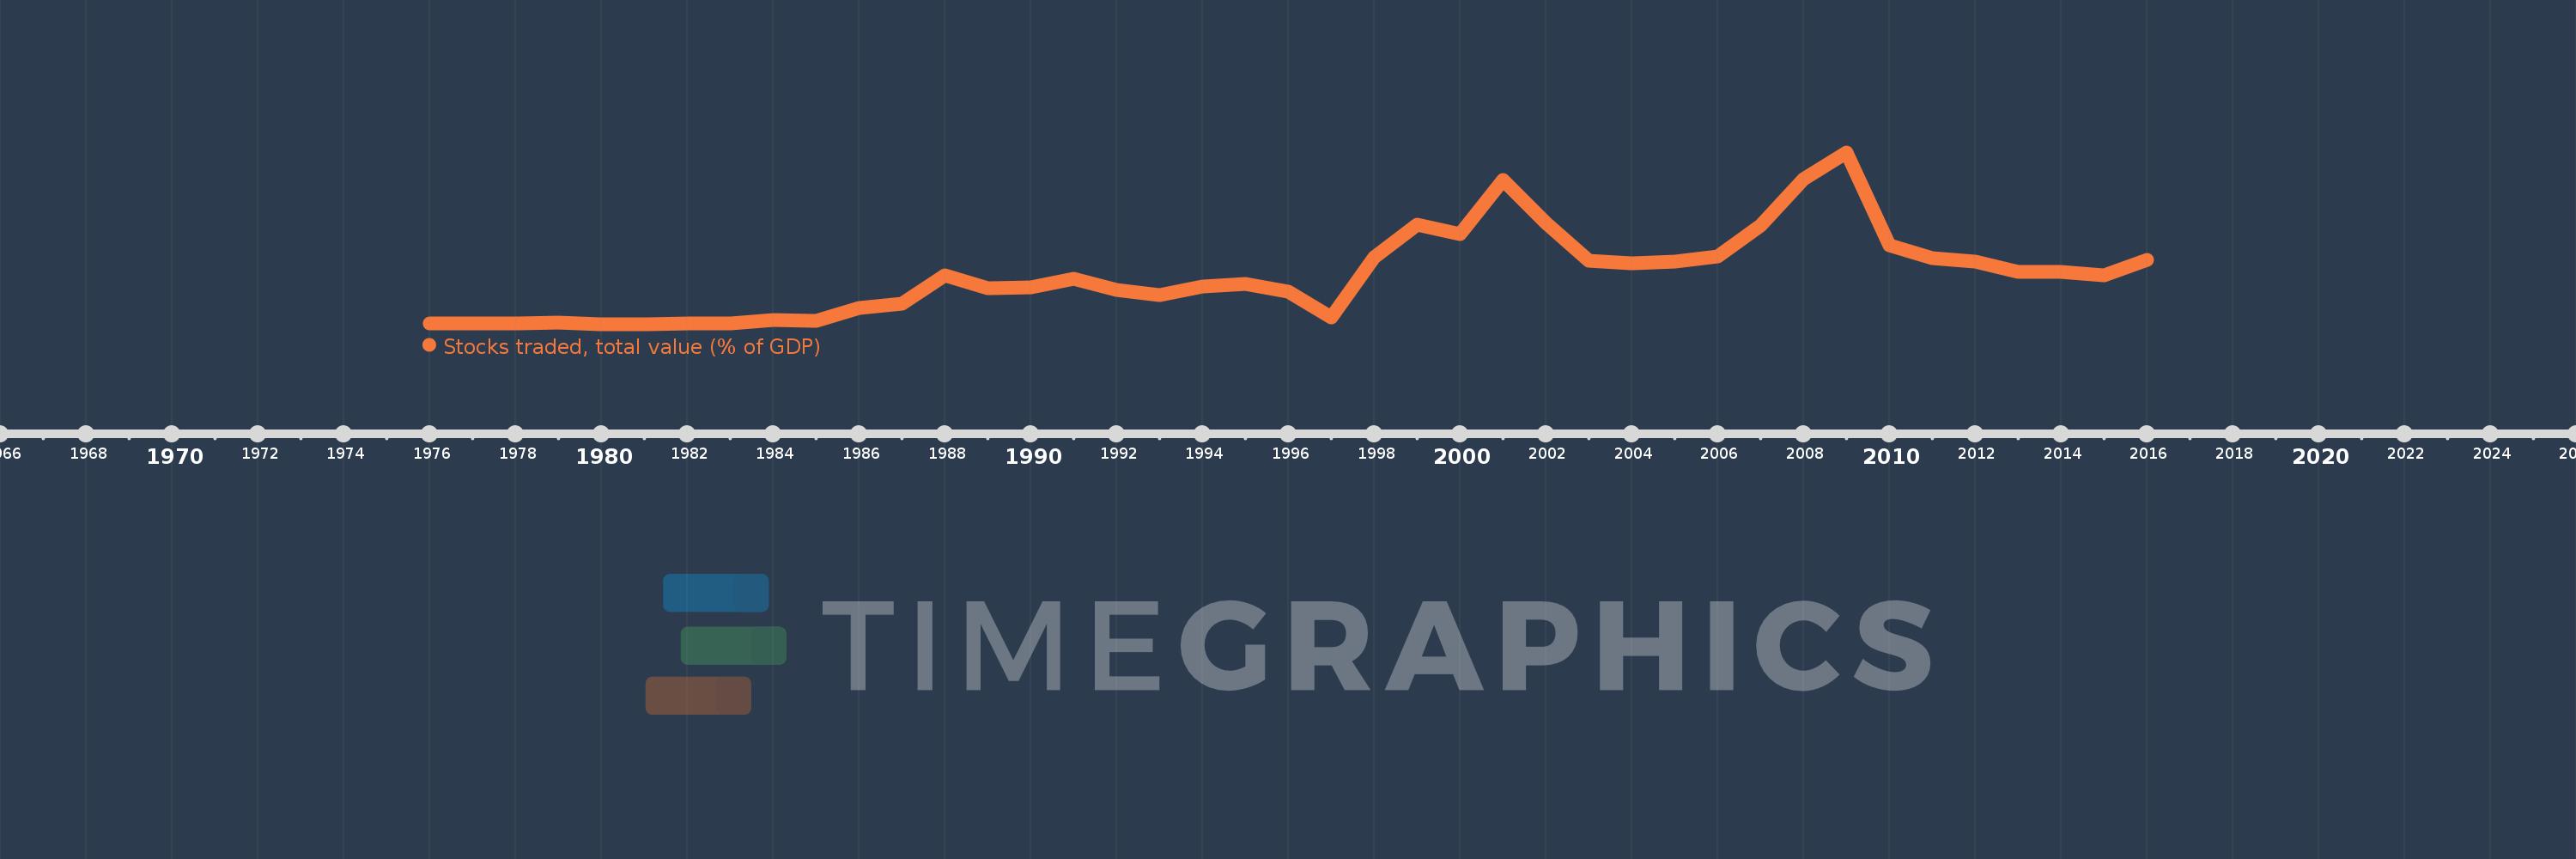
Stocks traded, total value (% of GDP)
2016,2015,2014,2013,2012,2011,2010,2009,2008,2007,2006,2005,2004,2003,2002,2001,2000,1999,1998,1997,1996,1995,1994,1993,1992,1991,1990,1989,1988,1987,1986,1985,1984,1983,1982,1981,1980,1979,1978,1977,1976
Estas estatísticas em outros países:
Linha do tempo:
Nesta escala de tempo está apresentado um gráfico de 1976 ano até 2016 ano Germany. Dados de 1975 ano ausente. O número de observações reais por data: 41.
Fonte (nome):
Indicadores de desenvolvimento mundial
Fonte (organização):
World Federation of Exchanges database.
Categorias:
Financial Sector
Foi atualizado:
23 abr 2017 ano
Indicadores de alterações dos valores ao longo dos anos
Mínimo:
1.495
1 jan 1981 ano
Máximo:
111.653
1 jan 2009 ano
Na data de observação
Valor
Mudança absoluta
A alteração em relação ao valor anterior
1 jan 1976 ano
2.147
+2.147
0.0%
1 jan 1977 ano
2.04
-0.107
-4.97%
1 jan 1978 ano
2.202
+0.161
7.91%
1 jan 1979 ano
2.549
+0.347
15.77%
1 jan 1980 ano
1.688
-0.861
-33.78%
1 jan 1981 ano
1.495
-0.194
-11.46%
1 jan 1982 ano
1.718
+0.224
14.96%
1 jan 1983 ano
1.912
+0.194
11.31%
1 jan 1984 ano
4.023
+2.11
110.35%
1 jan 1985 ano
3.725
-0.298
-7.41%
1 jan 1986 ano
11.731
+8.006
214.93%
1 jan 1987 ano
14.567
+2.836
24.17%
1 jan 1988 ano
32.817
+18.25
125.28%
1 jan 1989 ano
24.738
-8.079
-24.62%
1 jan 1990 ano
24.974
+0.236
0.95%
1 jan 1991 ano
30.736
+5.762
23.07%
1 jan 1992 ano
23.502
-7.234
-23.54%
1 jan 1993 ano
20.257
-3.245
-13.81%
1 jan 1994 ano
25.601
+5.344
26.38%
1 jan 1995 ano
27.367
+1.766
6.9%
1 jan 1996 ano
22.385
-4.982
-18.2%
1 jan 1997 ano
5.984
-16.401
-73.27%
1 jan 1998 ano
44.541
+38.557
644.38%
1 jan 1999 ano
65.474
+20.933
47.0%
1 jan 2000 ano
59.478
-5.996
-9.16%
1 jan 2001 ano
93.707
+34.229
57.55%
1 jan 2002 ano
66.698
-27.008
-28.82%
1 jan 2003 ano
41.929
-24.769
-37.14%
1 jan 2004 ano
40.598
-1.331
-3.17%
1 jan 2005 ano
41.901
+1.303
3.21%
1 jan 2006 ano
45.015
+3.114
7.43%
1 jan 2007 ano
64.975
+19.96
44.34%
1 jan 2008 ano
94.619
+29.644
45.62%
1 jan 2009 ano
111.653
+17.035
18.0%
1 jan 2010 ano
52.305
-59.348
-53.15%
1 jan 2011 ano
43.738
-8.567
-16.38%
1 jan 2012 ano
41.879
-1.859
-4.25%
1 jan 2013 ano
35.27
-6.61
-15.78%
1 jan 2014 ano
34.98
-0.29
-0.82%
1 jan 2015 ano
32.714
-2.266
-6.48%
1 jan 2016 ano
42.95
+10.236
31.29%
Classificação de países por estatísticas atuais por anos


Comentários: