30
/pt/
AIzaSyAYiBZKx7MnpbEhh9jyipgxe19OcubqV5w
April 1, 2024
133652
Finland
FIN
true
2
1
Stocks traded, total value (% of GDP)
2005,2004,2003,2002,2001,2000,1999,1998,1997,1996,1995,1994,1993,1992,1991,1990,1989,1988,1987,1986,1985,1984,1983
Download
Biblioteca de estatísticas globais →Finland →

Stocks traded, total value (% of GDP)

Estas estatísticas em outros países:

Arab WorldArgentinaArmeniaAustraliaAustriaBahrainBangladeshBarbadosBelgiumBermudaBoliviaBotswanaBrazilBulgariaCanadaCayman IslandsCentral Europe and the BalticsChannel IslandsChileChinaColombiaCosta RicaCote d'IvoireCroatiaCyprusCzech RepublicDenmarkEarly-demographic dividendEast Asia & PacificEast Asia & Pacific (excluding high income)East Asia & Pacific (IDA & IBRD countries)EcuadorEgypt, Arab Rep.El SalvadorEstoniaEuro areaEurope & Central AsiaEurope & Central Asia (excluding high income)Europe & Central Asia (IDA & IBRD countries)European UnionFijiFinlandFranceGeorgiaGermanyGhanaGreeceGuyanaHigh incomeHong Kong SAR, ChinaHungaryIBRD onlyIcelandIDA & IBRD totalIDA blendIDA totalIndiaIndonesiaIran, Islamic Rep.IrelandIsraelItalyJamaicaJapanJordanKazakhstanKenyaKorea, Rep.KuwaitKyrgyz RepublicLate-demographic dividendLatin America & Caribbean Latin America & Caribbean (excluding high income)Latin America & the Caribbean (IDA & IBRD countries)LatviaLebanonLithuaniaLow & middle incomeLower middle incomeLuxembourgMacedonia, FYRMalawiMalaysiaMaltaMauritiusMexicoMiddle East & North AfricaMiddle East & North Africa (excluding high income)Middle East & North Africa (IDA & IBRD countries)Middle incomeMoldovaMongoliaMontenegroMoroccoNamibiaNetherlandsNew ZealandNigeriaNorth AmericaNorwayOECD membersOmanOther small statesPakistanPanamaPapua New GuineaParaguayPeruPhilippinesPolandPortugalPost-demographic dividendQatarRomaniaRussian FederationSaudi ArabiaSerbiaSeychellesSingaporeSlovak RepublicSloveniaSouth AfricaSouth AsiaSouth Asia (IDA & IBRD)SpainSri LankaSt. Kitts and NevisSub-Saharan Africa Sub-Saharan Africa (excluding high income)Sub-Saharan Africa (IDA & IBRD countries)SwazilandSwedenSwitzerlandTanzaniaThailandTrinidad and TobagoTunisiaTurkeyUgandaUkraineUnited Arab EmiratesUnited KingdomUnited StatesUpper middle incomeUruguayUzbekistanVenezuela, RBVietnamWest Bank and GazaWorldZambiaZimbabwe

Linha do tempo:

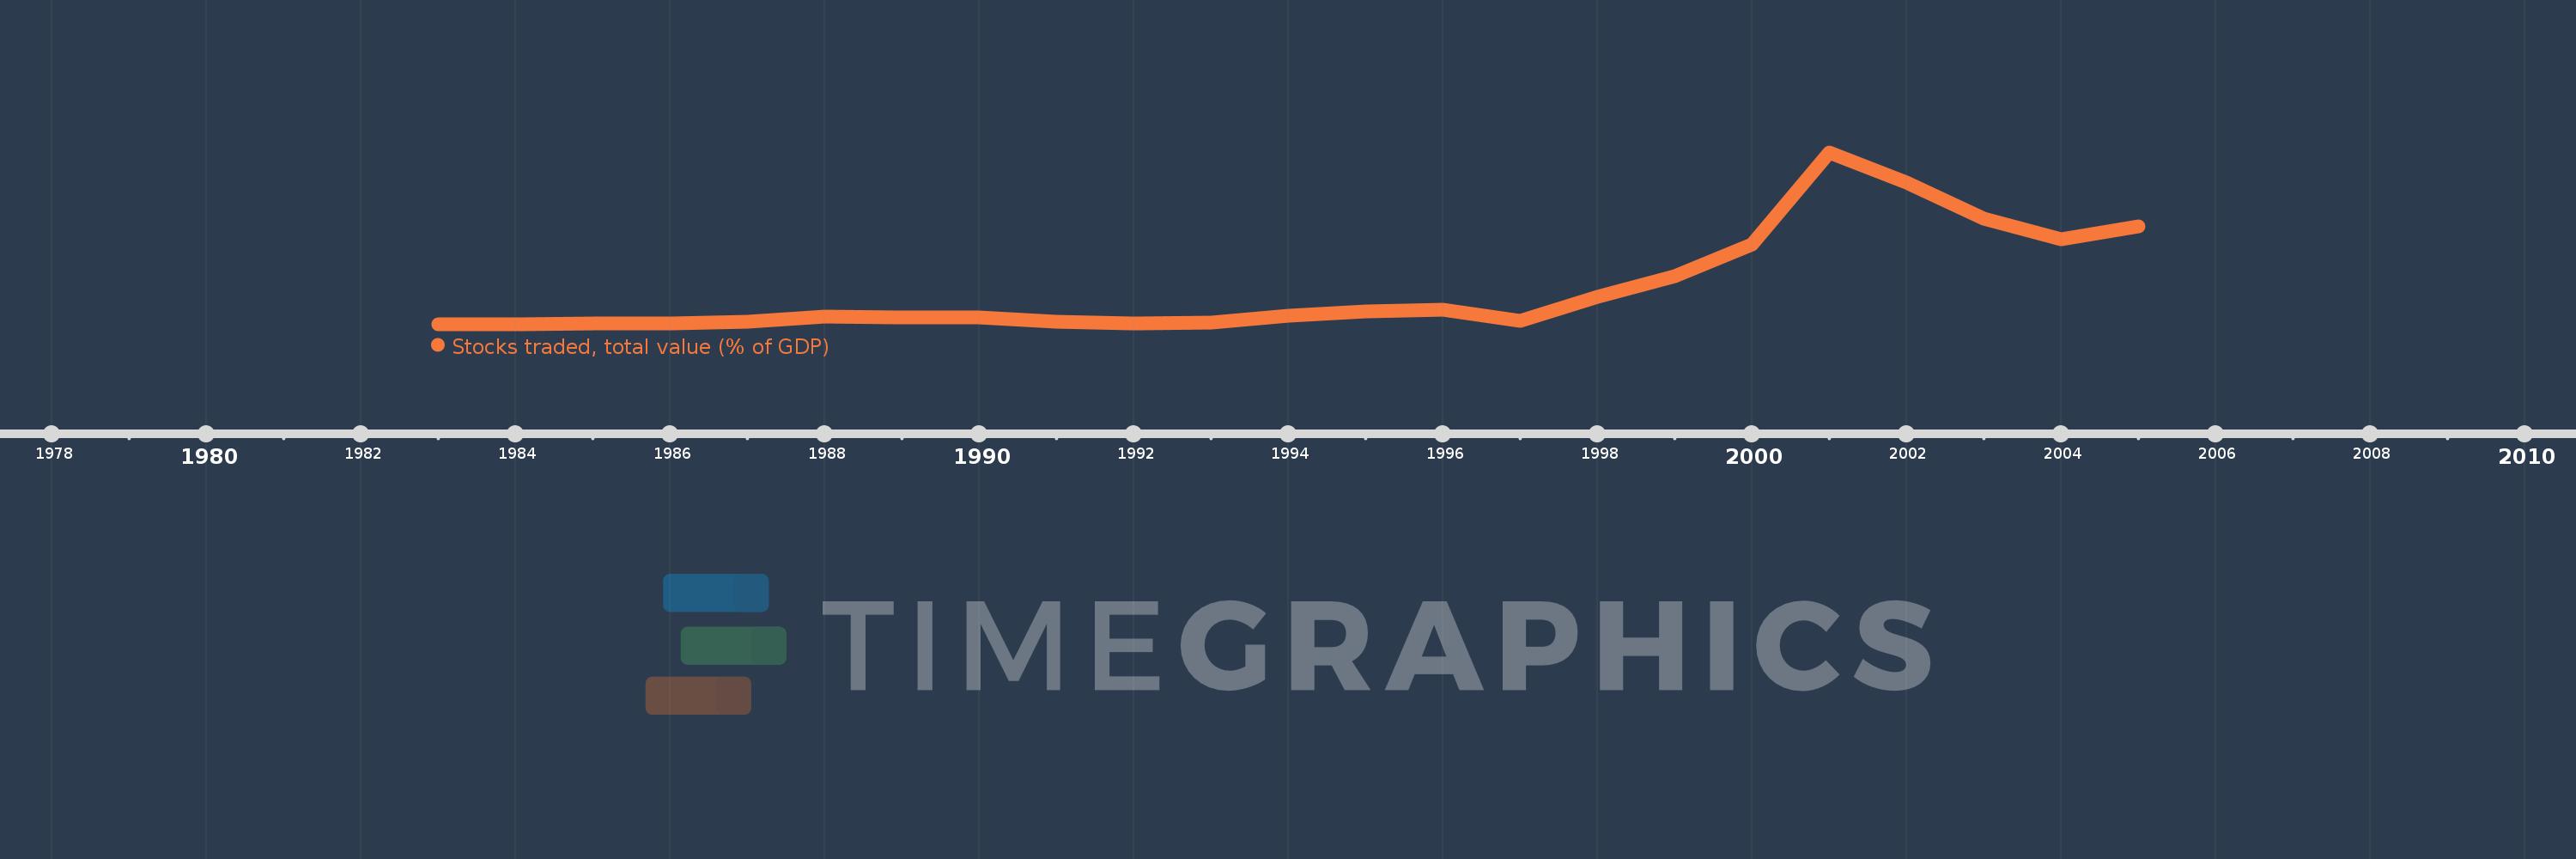
Nesta escala de tempo está apresentado um gráfico de 1983 ano até 2005 ano Finland. Dados de 1982 ano ausente. O número de observações reais por data: 23.

Fonte (nome):

Indicadores de desenvolvimento mundial

Fonte (organização):

World Federation of Exchanges database.

Categorias:

Financial Sector

Foi atualizado:

23 abr 2017 ano

Indicadores de alterações dos valores ao longo dos anos

Em média:
35.293
Mínimo:
0.26
1 jan 1983 ano
Máximo:
167.803
1 jan 2001 ano
Na data de observação
Valor
Mudança absoluta
A alteração em relação ao valor anterior
1 jan 1983 ano
0.26
+0.26
0.0%
1 jan 1984 ano
0.469
+0.208
80.0%
1 jan 1985 ano
0.726
+0.257
54.76%
1 jan 1986 ano
1.027
+0.301
41.5%
1 jan 1987 ano
2.686
+1.659
161.59%
1 jan 1988 ano
7.35
+4.665
173.69%
1 jan 1989 ano
6.507
-0.843
-11.46%
1 jan 1990 ano
6.538
+0.031
0.48%
1 jan 1991 ano
2.925
-3.614
-55.27%
1 jan 1992 ano
1.183
-1.741
-59.54%
1 jan 1993 ano
1.739
+0.555
46.93%
1 jan 1994 ano
8.75
+7.011
403.26%
1 jan 1995 ano
12.869
+4.119
47.07%
1 jan 1996 ano
14.312
+1.443
11.22%
1 jan 1997 ano
3.431
-10.881
-76.03%
1 jan 1998 ano
27.323
+23.892
696.33%
1 jan 1999 ano
47.482
+20.159
73.78%
1 jan 2000 ano
77.696
+30.214
63.63%
1 jan 2001 ano
167.803
+90.107
115.97%
1 jan 2002 ano
138.503
-29.3
-17.46%
1 jan 2003 ano
103.031
-35.472
-25.61%
1 jan 2004 ano
83.196
-19.836
-19.25%
1 jan 2005 ano
95.93
+12.734
15.31%

Classificação de países por estatísticas atuais por anos