29
/pt/
pt
AIzaSyAYiBZKx7MnpbEhh9jyipgxe19OcubqV5w
April 1, 2024
31813
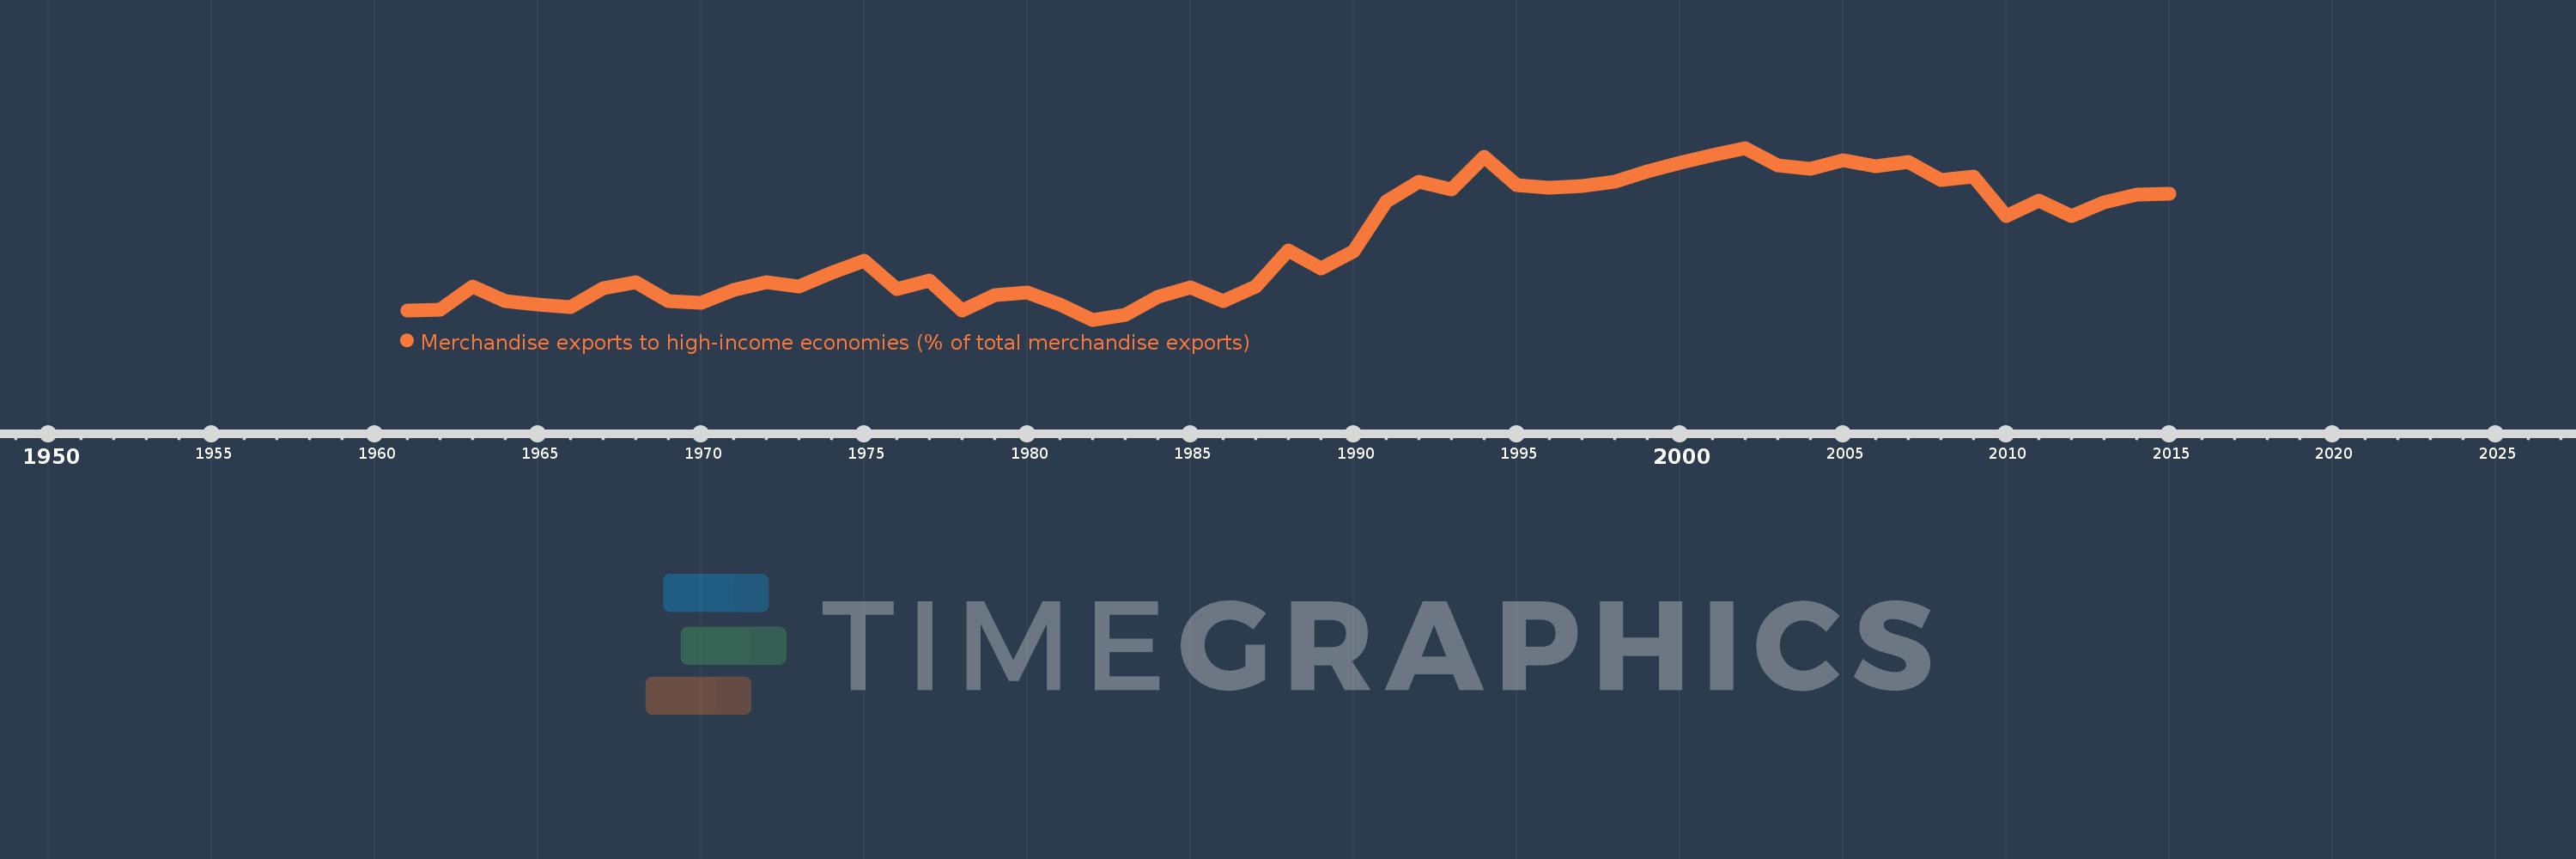
Europe & Central Asia (excluding high income)
ECA
false
2
1
Merchandise exports to high-income economies (% of total merchandise exports)
2015,2014,2013,2012,2011,2010,2009,2008,2007,2006,2005,2004,2003,2002,2001,2000,1999,1998,1997,1996,1995,1994,1993,1992,1991,1990,1989,1988,1987,1986,1985,1984,1983,1982,1981,1980,1979,1978,1977,1976,1975,1974,1973,1972,1971,1970,1969,1968,1967,1966,1965,1964,1963,1962,1961
Estas estatísticas em outros países:
AfghanistanAlbaniaAlgeriaAmerican SamoaAngolaAntigua and BarbudaArab WorldArgentinaArmeniaArubaAustraliaAustriaAzerbaijanBahamas, TheBahrainBangladeshBarbadosBelarusBelgiumBelizeBeninBermudaBoliviaBosnia and HerzegovinaBrazilBrunei DarussalamBulgariaBurkina FasoBurundiCabo VerdeCambodiaCameroonCanadaCaribbean small statesCentral African RepublicCentral Europe and the BalticsChadChileChinaColombiaComorosCongo, Dem. Rep.Congo, Rep.Costa RicaCote d'IvoireCroatiaCubaCyprusCzech RepublicDenmarkDjiboutiDominicaDominican RepublicEarly-demographic dividendEast Asia & PacificEast Asia & Pacific (excluding high income)East Asia & Pacific (IDA & IBRD countries)EcuadorEgypt, Arab Rep.El SalvadorEquatorial GuineaEstoniaEthiopiaEuro areaEurope & Central AsiaEurope & Central Asia (excluding high income)Europe & Central Asia (IDA & IBRD countries)European UnionFaroe IslandsFijiFinlandFragile and conflict affected situationsFranceFrench PolynesiaGabonGambia, TheGeorgiaGermanyGhanaGibraltarGreeceGreenlandGrenadaGuamGuatemalaGuineaGuinea-BissauGuyanaHaitiHeavily indebted poor countries (HIPC)High incomeHondurasHong Kong SAR, ChinaHungaryIBRD onlyIcelandIDA & IBRD totalIDA blendIDA onlyIDA totalIndiaIndonesiaIran, Islamic Rep.IraqIrelandIsraelItalyJamaicaJapanJordanKazakhstanKenyaKiribatiKorea, Dem. People’s Rep.Korea, Rep.KosovoKuwaitKyrgyz RepublicLao PDRLate-demographic dividendLatin America & Caribbean Latin America & Caribbean (excluding high income)Latin America & the Caribbean (IDA & IBRD countries)LatviaLeast developed countries: UN classificationLebanonLiberiaLibyaLithuaniaLow & middle incomeLow incomeLower middle incomeLuxembourgMacao SAR, ChinaMacedonia, FYRMadagascarMalawiMalaysiaMaldivesMaliMaltaMauritaniaMauritiusMexicoMiddle East & North AfricaMiddle East & North Africa (excluding high income)Middle East & North Africa (IDA & IBRD countries)Middle incomeMoldovaMongoliaMontenegroMoroccoMozambiqueMyanmarNauruNepalNetherlandsNew CaledoniaNew ZealandNicaraguaNigerNigeriaNorth AmericaNorwayOECD membersOmanOther small statesPacific island small statesPakistanPanamaPapua New GuineaParaguayPeruPhilippinesPolandPortugalPost-demographic dividendPre-demographic dividendQatarRomaniaRussian FederationRwandaSamoaSao Tome and PrincipeSaudi ArabiaSenegalSerbiaSeychellesSierra LeoneSingaporeSlovak RepublicSloveniaSmall statesSolomon IslandsSomaliaSouth AfricaSouth AsiaSouth Asia (IDA & IBRD)SpainSri LankaSt. Kitts and NevisSt. LuciaSt. Vincent and the GrenadinesSub-Saharan Africa Sub-Saharan Africa (excluding high income)Sub-Saharan Africa (IDA & IBRD countries)SudanSurinameSwedenSwitzerlandSyrian Arab RepublicTajikistanTanzaniaThailandTogoTongaTrinidad and TobagoTunisiaTurkeyTurkmenistanTuvaluUgandaUkraineUnited Arab EmiratesUnited KingdomUnited StatesUpper middle incomeUruguayUzbekistanVanuatuVenezuela, RBVietnamWorldYemen, Rep.ZambiaZimbabwe Linha do tempo:
Nesta escala de tempo está apresentado um gráfico de 1961 ano até 2015 ano Europe & Central Asia (excluding high income). Dados de 1960 ano ausente. O número de observações reais por data: 55.
Fonte (nome):
Indicadores de desenvolvimento mundial
Fonte (organização):
World Bank staff estimates based data from International Monetary Fund's Direction of Trade database.
Categorias:
Private Sector, Trade
Foi atualizado:
23 abr 2017 ano
Indicadores de alterações dos valores ao longo dos anos
Mínimo:
43.159
1 jan 1982 ano
Máximo:
72.885
1 jan 2002 ano
Na data de observação
Valor
Mudança absoluta
A alteração em relação ao valor anterior
1 jan 1961 ano
44.788
+44.788
0.0%
1 jan 1962 ano
44.845
+0.057
0.13%
1 jan 1963 ano
48.901
+4.056
9.04%
1 jan 1964 ano
46.31
-2.591
-5.3%
1 jan 1965 ano
45.75
-0.56
-1.21%
1 jan 1966 ano
45.392
-0.358
-0.78%
1 jan 1967 ano
48.645
+3.253
7.17%
1 jan 1968 ano
49.652
+1.006
2.07%
1 jan 1969 ano
46.397
-3.255
-6.56%
1 jan 1970 ano
46.046
-0.351
-0.76%
1 jan 1971 ano
48.358
+2.312
5.02%
1 jan 1972 ano
49.642
+1.284
2.66%
1 jan 1973 ano
48.86
-0.782
-1.58%
1 jan 1974 ano
51.327
+2.467
5.05%
1 jan 1975 ano
53.39
+2.063
4.02%
1 jan 1976 ano
48.423
-4.967
-9.3%
1 jan 1977 ano
50.015
+1.592
3.29%
1 jan 1978 ano
44.769
-5.247
-10.49%
1 jan 1979 ano
47.382
+2.613
5.84%
1 jan 1980 ano
47.848
+0.466
0.98%
1 jan 1981 ano
45.838
-2.01
-4.2%
1 jan 1982 ano
43.159
-2.679
-5.84%
1 jan 1983 ano
44.026
+0.867
2.01%
1 jan 1984 ano
47.164
+3.138
7.13%
1 jan 1985 ano
48.76
+1.596
3.38%
1 jan 1986 ano
46.455
-2.305
-4.73%
1 jan 1987 ano
48.915
+2.46
5.3%
1 jan 1988 ano
55.107
+6.191
12.66%
1 jan 1989 ano
52.031
-3.076
-5.58%
1 jan 1990 ano
55.039
+3.007
5.78%
1 jan 1991 ano
63.572
+8.533
15.5%
1 jan 1992 ano
67.075
+3.504
5.51%
1 jan 1993 ano
65.679
-1.396
-2.08%
1 jan 1994 ano
71.427
+5.748
8.75%
1 jan 1995 ano
66.51
-4.917
-6.88%
1 jan 1996 ano
66.065
-0.445
-0.67%
1 jan 1997 ano
66.268
+0.203
0.31%
1 jan 1998 ano
67.074
+0.807
1.22%
1 jan 1999 ano
68.79
+1.716
2.56%
1 jan 2000 ano
70.348
+1.558
2.26%
1 jan 2001 ano
71.603
+1.255
1.78%
1 jan 2002 ano
72.885
+1.282
1.79%
1 jan 2003 ano
69.844
-3.041
-4.17%
1 jan 2004 ano
69.216
-0.628
-0.9%
1 jan 2005 ano
70.827
+1.611
2.33%
1 jan 2006 ano
69.708
-1.119
-1.58%
1 jan 2007 ano
70.406
+0.699
1.0%
1 jan 2008 ano
67.345
-3.061
-4.35%
1 jan 2009 ano
67.964
+0.618
0.92%
1 jan 2010 ano
61.166
-6.798
-10.0%
1 jan 2011 ano
63.816
+2.65
4.33%
1 jan 2012 ano
61.139
-2.677
-4.19%
1 jan 2013 ano
63.408
+2.269
3.71%
1 jan 2014 ano
64.782
+1.374
2.17%
1 jan 2015 ano
64.979
+0.197
0.3%
Classificação de países por estatísticas atuais por anos


Comentários: