29
/pt/
pt
AIzaSyAYiBZKx7MnpbEhh9jyipgxe19OcubqV5w
April 1, 2024
25079
Caribbean small states
CSS
false
2
1
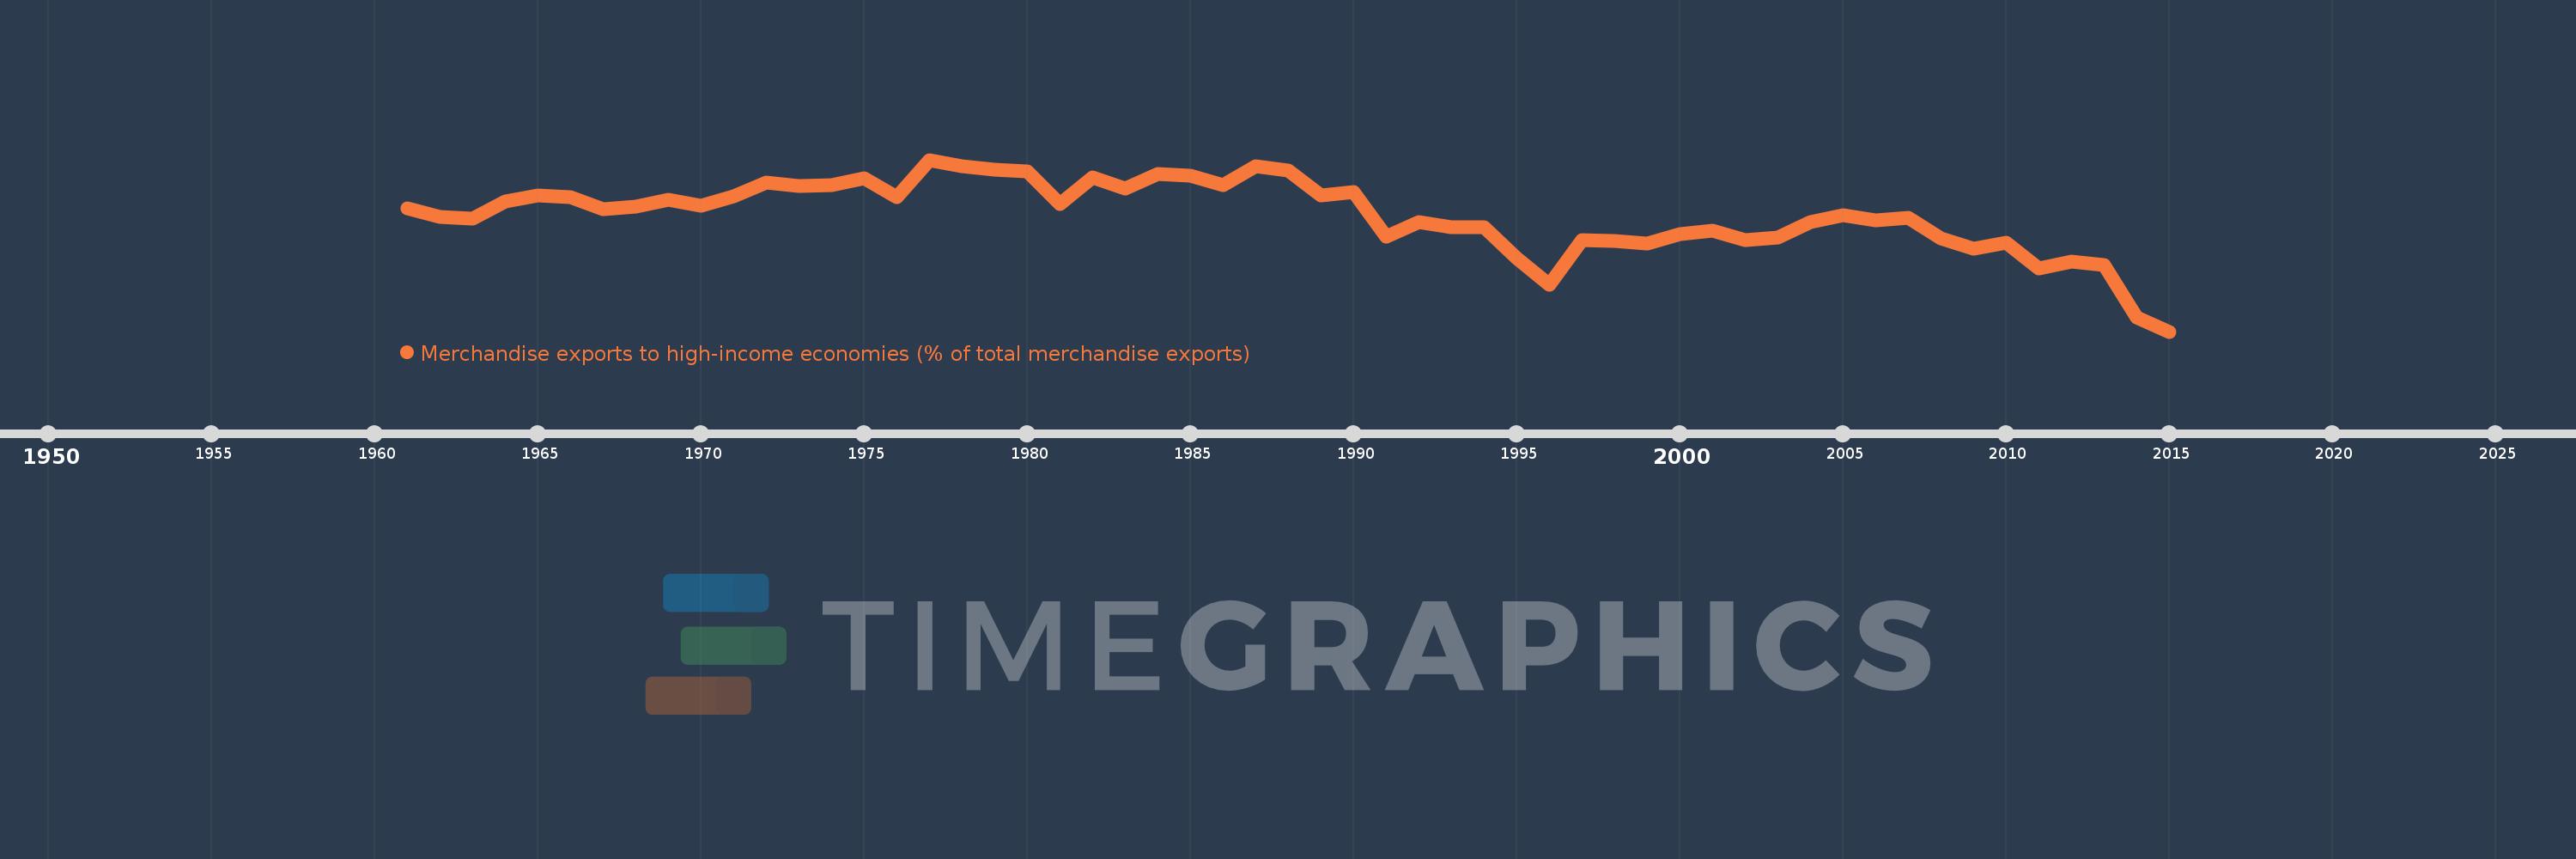
Merchandise exports to high-income economies (% of total merchandise exports)
2015,2014,2013,2012,2011,2010,2009,2008,2007,2006,2005,2004,2003,2002,2001,2000,1999,1998,1997,1996,1995,1994,1993,1992,1991,1990,1989,1988,1987,1986,1985,1984,1983,1982,1981,1980,1979,1978,1977,1976,1975,1974,1973,1972,1971,1970,1969,1968,1967,1966,1965,1964,1963,1962,1961
Estas estatísticas em outros países:
AfghanistanAlbaniaAlgeriaAmerican SamoaAngolaAntigua and BarbudaArab WorldArgentinaArmeniaArubaAustraliaAustriaAzerbaijanBahamas, TheBahrainBangladeshBarbadosBelarusBelgiumBelizeBeninBermudaBoliviaBosnia and HerzegovinaBrazilBrunei DarussalamBulgariaBurkina FasoBurundiCabo VerdeCambodiaCameroonCanadaCaribbean small statesCentral African RepublicCentral Europe and the BalticsChadChileChinaColombiaComorosCongo, Dem. Rep.Congo, Rep.Costa RicaCote d'IvoireCroatiaCubaCyprusCzech RepublicDenmarkDjiboutiDominicaDominican RepublicEarly-demographic dividendEast Asia & PacificEast Asia & Pacific (excluding high income)East Asia & Pacific (IDA & IBRD countries)EcuadorEgypt, Arab Rep.El SalvadorEquatorial GuineaEstoniaEthiopiaEuro areaEurope & Central AsiaEurope & Central Asia (excluding high income)Europe & Central Asia (IDA & IBRD countries)European UnionFaroe IslandsFijiFinlandFragile and conflict affected situationsFranceFrench PolynesiaGabonGambia, TheGeorgiaGermanyGhanaGibraltarGreeceGreenlandGrenadaGuamGuatemalaGuineaGuinea-BissauGuyanaHaitiHeavily indebted poor countries (HIPC)High incomeHondurasHong Kong SAR, ChinaHungaryIBRD onlyIcelandIDA & IBRD totalIDA blendIDA onlyIDA totalIndiaIndonesiaIran, Islamic Rep.IraqIrelandIsraelItalyJamaicaJapanJordanKazakhstanKenyaKiribatiKorea, Dem. People’s Rep.Korea, Rep.KosovoKuwaitKyrgyz RepublicLao PDRLate-demographic dividendLatin America & Caribbean Latin America & Caribbean (excluding high income)Latin America & the Caribbean (IDA & IBRD countries)LatviaLeast developed countries: UN classificationLebanonLiberiaLibyaLithuaniaLow & middle incomeLow incomeLower middle incomeLuxembourgMacao SAR, ChinaMacedonia, FYRMadagascarMalawiMalaysiaMaldivesMaliMaltaMauritaniaMauritiusMexicoMiddle East & North AfricaMiddle East & North Africa (excluding high income)Middle East & North Africa (IDA & IBRD countries)Middle incomeMoldovaMongoliaMontenegroMoroccoMozambiqueMyanmarNauruNepalNetherlandsNew CaledoniaNew ZealandNicaraguaNigerNigeriaNorth AmericaNorwayOECD membersOmanOther small statesPacific island small statesPakistanPanamaPapua New GuineaParaguayPeruPhilippinesPolandPortugalPost-demographic dividendPre-demographic dividendQatarRomaniaRussian FederationRwandaSamoaSao Tome and PrincipeSaudi ArabiaSenegalSerbiaSeychellesSierra LeoneSingaporeSlovak RepublicSloveniaSmall statesSolomon IslandsSomaliaSouth AfricaSouth AsiaSouth Asia (IDA & IBRD)SpainSri LankaSt. Kitts and NevisSt. LuciaSt. Vincent and the GrenadinesSub-Saharan Africa Sub-Saharan Africa (excluding high income)Sub-Saharan Africa (IDA & IBRD countries)SudanSurinameSwedenSwitzerlandSyrian Arab RepublicTajikistanTanzaniaThailandTogoTongaTrinidad and TobagoTunisiaTurkeyTurkmenistanTuvaluUgandaUkraineUnited Arab EmiratesUnited KingdomUnited StatesUpper middle incomeUruguayUzbekistanVanuatuVenezuela, RBVietnamWorldYemen, Rep.ZambiaZimbabwe Linha do tempo:
Nesta escala de tempo está apresentado um gráfico de 1961 ano até 2015 ano Caribbean small states. Dados de 1960 ano ausente. O número de observações reais por data: 55.
Fonte (nome):
Indicadores de desenvolvimento mundial
Fonte (organização):
World Bank staff estimates based data from International Monetary Fund's Direction of Trade database.
Categorias:
Private Sector, Trade
Foi atualizado:
23 abr 2017 ano
Indicadores de alterações dos valores ao longo dos anos
Mínimo:
64.809
1 jan 2015 ano
Máximo:
90.476
1 jan 1977 ano
Na data de observação
Valor
Mudança absoluta
A alteração em relação ao valor anterior
1 jan 1961 ano
83.277
+83.277
0.0%
1 jan 1962 ano
81.975
-1.302
-1.56%
1 jan 1963 ano
81.638
-0.337
-0.41%
1 jan 1964 ano
84.302
+2.663
3.26%
1 jan 1965 ano
85.213
+0.911
1.08%
1 jan 1966 ano
84.875
-0.337
-0.4%
1 jan 1967 ano
83.102
-1.773
-2.09%
1 jan 1968 ano
83.496
+0.394
0.47%
1 jan 1969 ano
84.561
+1.065
1.28%
1 jan 1970 ano
83.631
-0.929
-1.1%
1 jan 1971 ano
85.006
+1.374
1.64%
1 jan 1972 ano
87.011
+2.006
2.36%
1 jan 1973 ano
86.522
-0.49
-0.56%
1 jan 1974 ano
86.655
+0.133
0.15%
1 jan 1975 ano
87.735
+1.08
1.25%
1 jan 1976 ano
84.913
-2.822
-3.22%
1 jan 1977 ano
90.476
+5.563
6.55%
1 jan 1978 ano
89.459
-1.017
-1.12%
1 jan 1979 ano
88.977
-0.481
-0.54%
1 jan 1980 ano
88.769
-0.208
-0.23%
1 jan 1981 ano
83.905
-4.864
-5.48%
1 jan 1982 ano
87.902
+3.998
4.76%
1 jan 1983 ano
86.133
-1.769
-2.01%
1 jan 1984 ano
88.303
+2.17
2.52%
1 jan 1985 ano
88.133
-0.17
-0.19%
1 jan 1986 ano
86.739
-1.394
-1.58%
1 jan 1987 ano
89.478
+2.738
3.16%
1 jan 1988 ano
88.912
-0.566
-0.63%
1 jan 1989 ano
85.174
-3.738
-4.2%
1 jan 1990 ano
85.672
+0.498
0.58%
1 jan 1991 ano
79.009
-6.663
-7.78%
1 jan 1992 ano
81.219
+2.21
2.8%
1 jan 1993 ano
80.402
-0.816
-1.0%
1 jan 1994 ano
80.343
-0.06
-0.07%
1 jan 1995 ano
75.751
-4.592
-5.72%
1 jan 1996 ano
71.792
-3.959
-5.23%
1 jan 1997 ano
78.523
+6.731
9.38%
1 jan 1998 ano
78.343
-0.18
-0.23%
1 jan 1999 ano
78.016
-0.327
-0.42%
1 jan 2000 ano
79.426
+1.41
1.81%
1 jan 2001 ano
79.865
+0.438
0.55%
1 jan 2002 ano
78.457
-1.407
-1.76%
1 jan 2003 ano
78.889
+0.431
0.55%
1 jan 2004 ano
81.176
+2.288
2.9%
1 jan 2005 ano
82.218
+1.042
1.28%
1 jan 2006 ano
81.475
-0.743
-0.9%
1 jan 2007 ano
81.846
+0.371
0.45%
1 jan 2008 ano
78.791
-3.054
-3.73%
1 jan 2009 ano
77.159
-1.633
-2.07%
1 jan 2010 ano
78.116
+0.957
1.24%
1 jan 2011 ano
74.261
-3.855
-4.93%
1 jan 2012 ano
75.285
+1.024
1.38%
1 jan 2013 ano
74.789
-0.496
-0.66%
1 jan 2014 ano
66.931
-7.858
-10.51%
1 jan 2015 ano
64.809
-2.121
-3.17%
Classificação de países por estatísticas atuais por anos


Comentários: