29
/pt/
pt
AIzaSyAYiBZKx7MnpbEhh9jyipgxe19OcubqV5w
April 1, 2024
27469
East Asia & Pacific
EAS
false
2
1
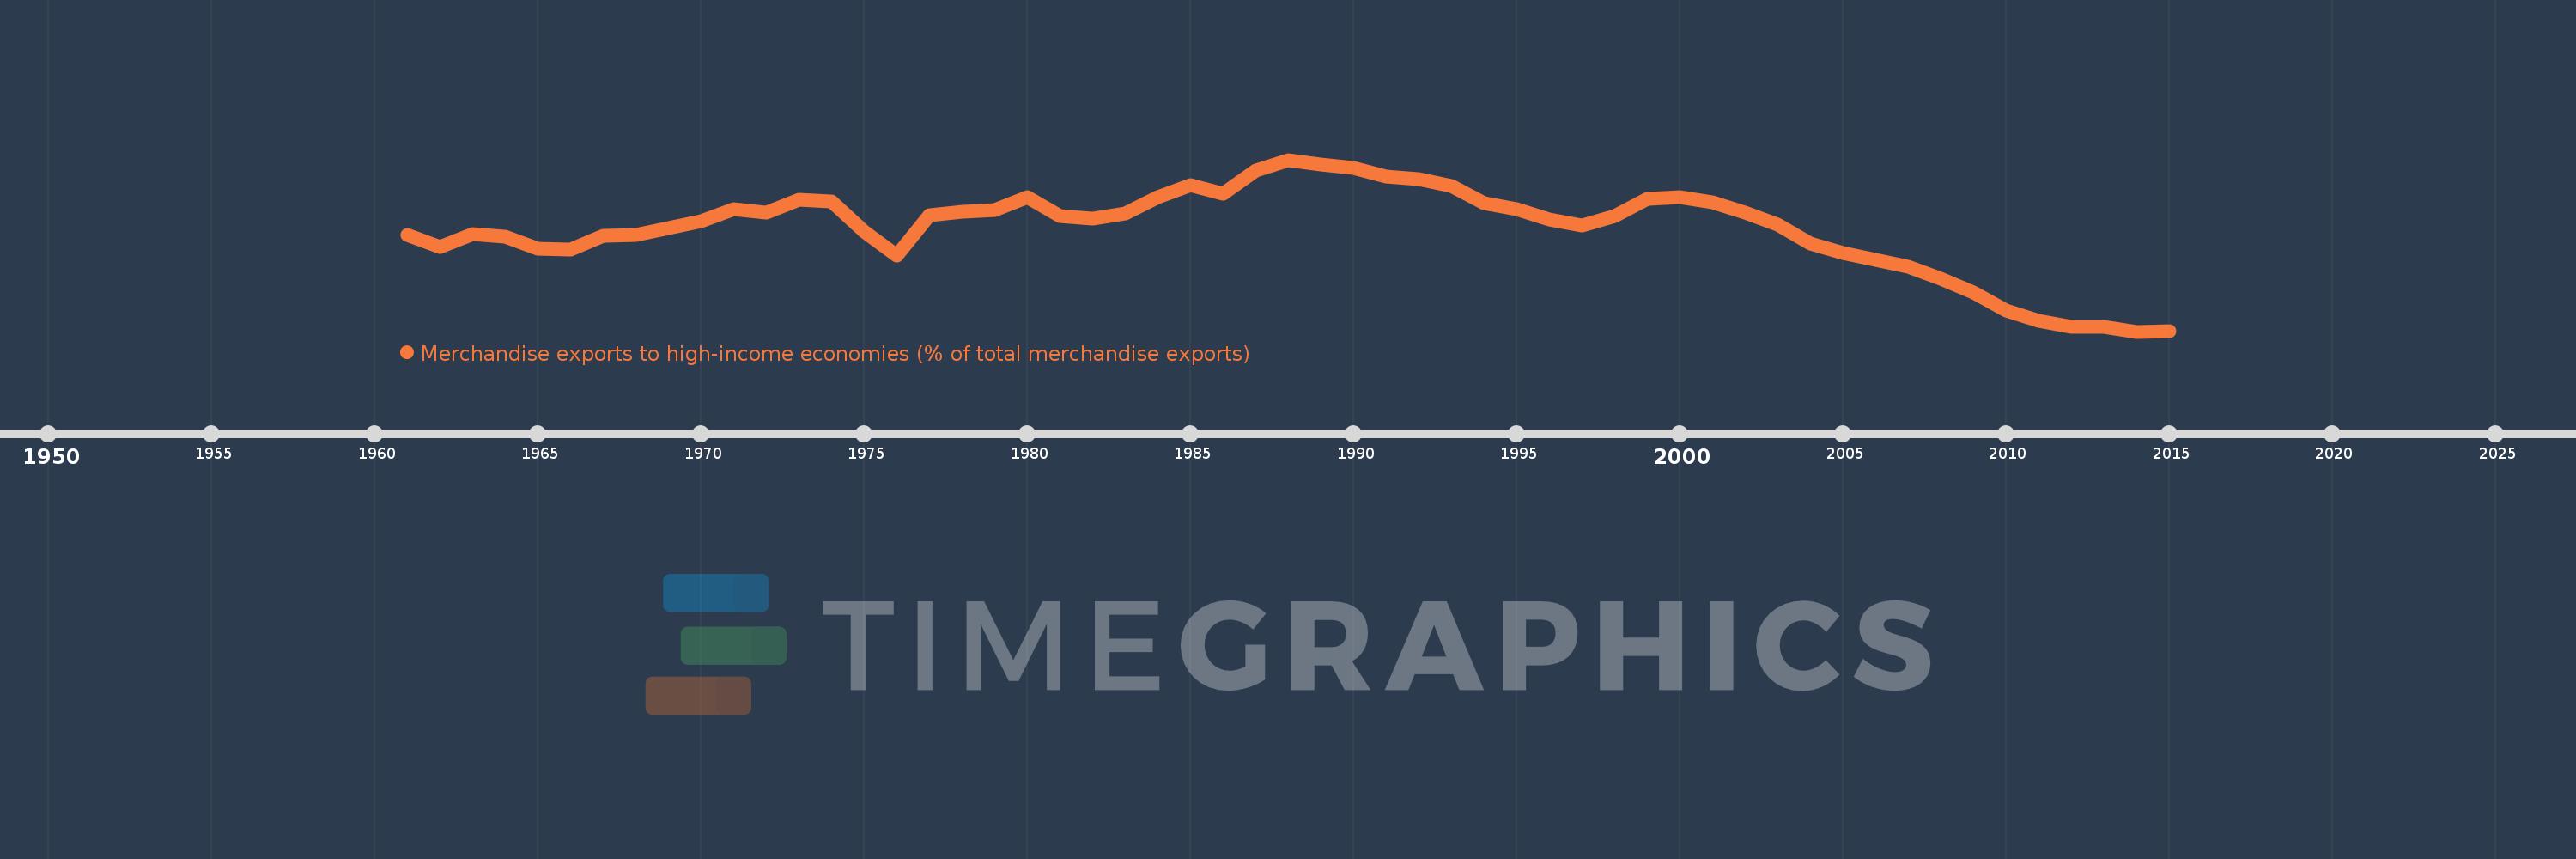
Merchandise exports to high-income economies (% of total merchandise exports)
2015,2014,2013,2012,2011,2010,2009,2008,2007,2006,2005,2004,2003,2002,2001,2000,1999,1998,1997,1996,1995,1994,1993,1992,1991,1990,1989,1988,1987,1986,1985,1984,1983,1982,1981,1980,1979,1978,1977,1976,1975,1974,1973,1972,1971,1970,1969,1968,1967,1966,1965,1964,1963,1962,1961
Estas estatísticas em outros países:
AfghanistanAlbaniaAlgeriaAmerican SamoaAngolaAntigua and BarbudaArab WorldArgentinaArmeniaArubaAustraliaAustriaAzerbaijanBahamas, TheBahrainBangladeshBarbadosBelarusBelgiumBelizeBeninBermudaBoliviaBosnia and HerzegovinaBrazilBrunei DarussalamBulgariaBurkina FasoBurundiCabo VerdeCambodiaCameroonCanadaCaribbean small statesCentral African RepublicCentral Europe and the BalticsChadChileChinaColombiaComorosCongo, Dem. Rep.Congo, Rep.Costa RicaCote d'IvoireCroatiaCubaCyprusCzech RepublicDenmarkDjiboutiDominicaDominican RepublicEarly-demographic dividendEast Asia & PacificEast Asia & Pacific (excluding high income)East Asia & Pacific (IDA & IBRD countries)EcuadorEgypt, Arab Rep.El SalvadorEquatorial GuineaEstoniaEthiopiaEuro areaEurope & Central AsiaEurope & Central Asia (excluding high income)Europe & Central Asia (IDA & IBRD countries)European UnionFaroe IslandsFijiFinlandFragile and conflict affected situationsFranceFrench PolynesiaGabonGambia, TheGeorgiaGermanyGhanaGibraltarGreeceGreenlandGrenadaGuamGuatemalaGuineaGuinea-BissauGuyanaHaitiHeavily indebted poor countries (HIPC)High incomeHondurasHong Kong SAR, ChinaHungaryIBRD onlyIcelandIDA & IBRD totalIDA blendIDA onlyIDA totalIndiaIndonesiaIran, Islamic Rep.IraqIrelandIsraelItalyJamaicaJapanJordanKazakhstanKenyaKiribatiKorea, Dem. People’s Rep.Korea, Rep.KosovoKuwaitKyrgyz RepublicLao PDRLate-demographic dividendLatin America & Caribbean Latin America & Caribbean (excluding high income)Latin America & the Caribbean (IDA & IBRD countries)LatviaLeast developed countries: UN classificationLebanonLiberiaLibyaLithuaniaLow & middle incomeLow incomeLower middle incomeLuxembourgMacao SAR, ChinaMacedonia, FYRMadagascarMalawiMalaysiaMaldivesMaliMaltaMauritaniaMauritiusMexicoMiddle East & North AfricaMiddle East & North Africa (excluding high income)Middle East & North Africa (IDA & IBRD countries)Middle incomeMoldovaMongoliaMontenegroMoroccoMozambiqueMyanmarNauruNepalNetherlandsNew CaledoniaNew ZealandNicaraguaNigerNigeriaNorth AmericaNorwayOECD membersOmanOther small statesPacific island small statesPakistanPanamaPapua New GuineaParaguayPeruPhilippinesPolandPortugalPost-demographic dividendPre-demographic dividendQatarRomaniaRussian FederationRwandaSamoaSao Tome and PrincipeSaudi ArabiaSenegalSerbiaSeychellesSierra LeoneSingaporeSlovak RepublicSloveniaSmall statesSolomon IslandsSomaliaSouth AfricaSouth AsiaSouth Asia (IDA & IBRD)SpainSri LankaSt. Kitts and NevisSt. LuciaSt. Vincent and the GrenadinesSub-Saharan Africa Sub-Saharan Africa (excluding high income)Sub-Saharan Africa (IDA & IBRD countries)SudanSurinameSwedenSwitzerlandSyrian Arab RepublicTajikistanTanzaniaThailandTogoTongaTrinidad and TobagoTunisiaTurkeyTurkmenistanTuvaluUgandaUkraineUnited Arab EmiratesUnited KingdomUnited StatesUpper middle incomeUruguayUzbekistanVanuatuVenezuela, RBVietnamWorldYemen, Rep.ZambiaZimbabwe Linha do tempo:
Nesta escala de tempo está apresentado um gráfico de 1961 ano até 2015 ano East Asia & Pacific. Dados de 1960 ano ausente. O número de observações reais por data: 55.
Fonte (nome):
Indicadores de desenvolvimento mundial
Fonte (organização):
World Bank staff estimates based data from International Monetary Fund's Direction of Trade database.
Categorias:
Private Sector, Trade
Foi atualizado:
23 abr 2017 ano
Indicadores de alterações dos valores ao longo dos anos
Mínimo:
60.618
1 jan 2014 ano
Máximo:
80.81
1 jan 1988 ano
Na data de observação
Valor
Mudança absoluta
A alteração em relação ao valor anterior
1 jan 1961 ano
71.941
+71.941
0.0%
1 jan 1962 ano
70.552
-1.389
-1.93%
1 jan 1963 ano
72.066
+1.515
2.15%
1 jan 1964 ano
71.725
-0.341
-0.47%
1 jan 1965 ano
70.311
-1.414
-1.97%
1 jan 1966 ano
70.245
-0.066
-0.09%
1 jan 1967 ano
71.855
+1.61
2.29%
1 jan 1968 ano
71.997
+0.142
0.2%
1 jan 1969 ano
72.786
+0.789
1.1%
1 jan 1970 ano
73.551
+0.765
1.05%
1 jan 1971 ano
75.011
+1.46
1.98%
1 jan 1972 ano
74.598
-0.414
-0.55%
1 jan 1973 ano
76.103
+1.505
2.02%
1 jan 1974 ano
75.954
-0.149
-0.2%
1 jan 1975 ano
72.41
-3.544
-4.67%
1 jan 1976 ano
69.511
-2.899
-4.0%
1 jan 1977 ano
74.307
+4.796
6.9%
1 jan 1978 ano
74.752
+0.445
0.6%
1 jan 1979 ano
74.883
+0.131
0.18%
1 jan 1980 ano
76.442
+1.559
2.08%
1 jan 1981 ano
74.238
-2.204
-2.88%
1 jan 1982 ano
73.92
-0.318
-0.43%
1 jan 1983 ano
74.543
+0.624
0.84%
1 jan 1984 ano
76.462
+1.918
2.57%
1 jan 1985 ano
77.814
+1.352
1.77%
1 jan 1986 ano
76.788
-1.026
-1.32%
1 jan 1987 ano
79.548
+2.761
3.6%
1 jan 1988 ano
80.81
+1.261
1.59%
1 jan 1989 ano
80.266
-0.544
-0.67%
1 jan 1990 ano
79.894
-0.371
-0.46%
1 jan 1991 ano
78.845
-1.049
-1.31%
1 jan 1992 ano
78.506
-0.339
-0.43%
1 jan 1993 ano
77.692
-0.813
-1.04%
1 jan 1994 ano
75.725
-1.968
-2.53%
1 jan 1995 ano
75.048
-0.676
-0.89%
1 jan 1996 ano
73.822
-1.227
-1.63%
1 jan 1997 ano
73.125
-0.697
-0.94%
1 jan 1998 ano
74.175
+1.05
1.44%
1 jan 1999 ano
76.222
+2.047
2.76%
1 jan 2000 ano
76.433
+0.211
0.28%
1 jan 2001 ano
75.787
-0.646
-0.84%
1 jan 2002 ano
74.551
-1.236
-1.63%
1 jan 2003 ano
73.21
-1.341
-1.8%
1 jan 2004 ano
70.987
-2.223
-3.04%
1 jan 2005 ano
69.874
-1.113
-1.57%
1 jan 2006 ano
69.022
-0.852
-1.22%
1 jan 2007 ano
68.22
-0.802
-1.16%
1 jan 2008 ano
66.85
-1.37
-2.01%
1 jan 2009 ano
65.204
-1.645
-2.46%
1 jan 2010 ano
63.131
-2.074
-3.18%
1 jan 2011 ano
61.92
-1.211
-1.92%
1 jan 2012 ano
61.19
-0.73
-1.18%
1 jan 2013 ano
61.215
+0.025
0.04%
1 jan 2014 ano
60.618
-0.597
-0.97%
1 jan 2015 ano
60.682
+0.063
0.1%
Classificação de países por estatísticas atuais por anos


Comentários: