29
/pt/
pt
AIzaSyAYiBZKx7MnpbEhh9jyipgxe19OcubqV5w
April 1, 2024
261179
Tanzania
TZA
true
2
1
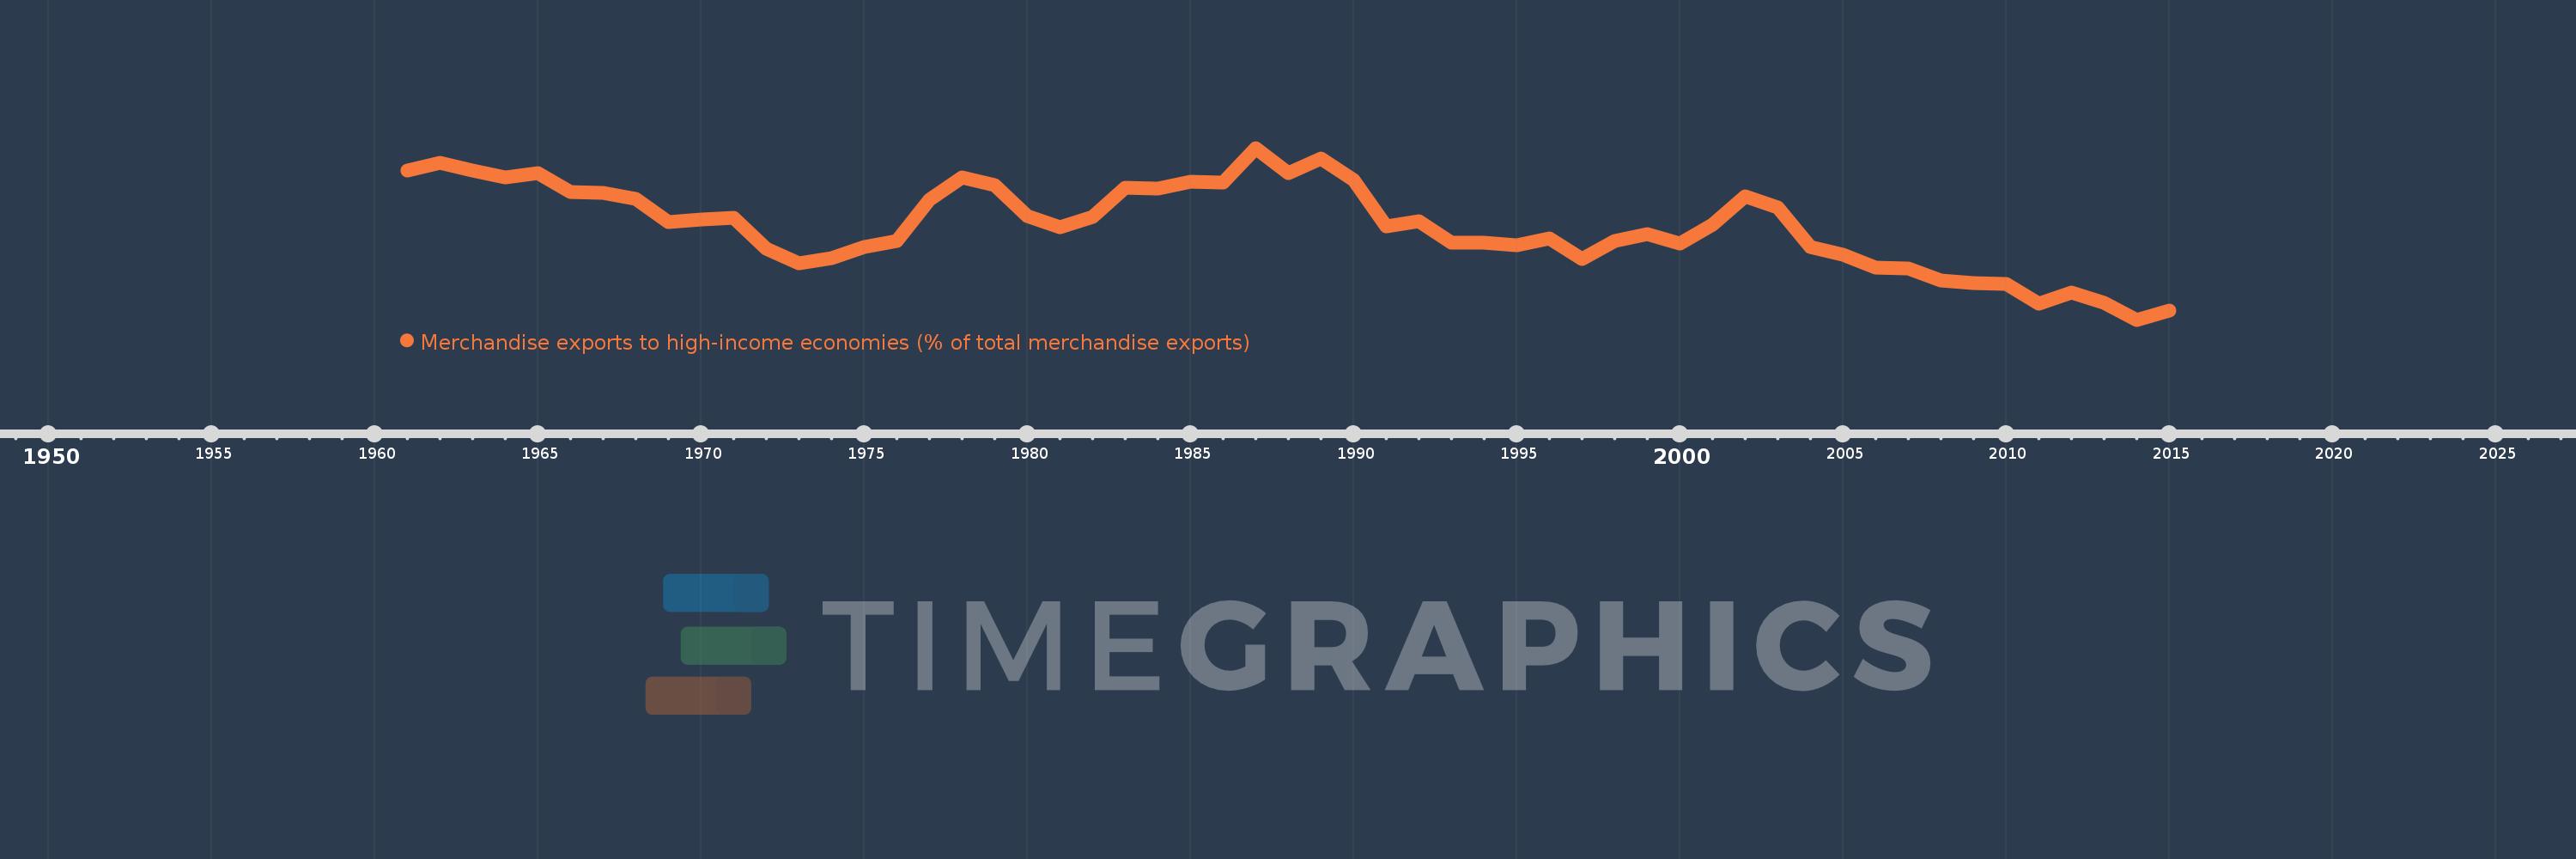
Merchandise exports to high-income economies (% of total merchandise exports)
2015,2014,2013,2012,2011,2010,2009,2008,2007,2006,2005,2004,2003,2002,2001,2000,1999,1998,1997,1996,1995,1994,1993,1992,1991,1990,1989,1988,1987,1986,1985,1984,1983,1982,1981,1980,1979,1978,1977,1976,1975,1974,1973,1972,1971,1970,1969,1968,1967,1966,1965,1964,1963,1962,1961
Estas estatísticas em outros países:
AfghanistanAlbaniaAlgeriaAmerican SamoaAngolaAntigua and BarbudaArab WorldArgentinaArmeniaArubaAustraliaAustriaAzerbaijanBahamas, TheBahrainBangladeshBarbadosBelarusBelgiumBelizeBeninBermudaBoliviaBosnia and HerzegovinaBrazilBrunei DarussalamBulgariaBurkina FasoBurundiCabo VerdeCambodiaCameroonCanadaCaribbean small statesCentral African RepublicCentral Europe and the BalticsChadChileChinaColombiaComorosCongo, Dem. Rep.Congo, Rep.Costa RicaCote d'IvoireCroatiaCubaCyprusCzech RepublicDenmarkDjiboutiDominicaDominican RepublicEarly-demographic dividendEast Asia & PacificEast Asia & Pacific (excluding high income)East Asia & Pacific (IDA & IBRD countries)EcuadorEgypt, Arab Rep.El SalvadorEquatorial GuineaEstoniaEthiopiaEuro areaEurope & Central AsiaEurope & Central Asia (excluding high income)Europe & Central Asia (IDA & IBRD countries)European UnionFaroe IslandsFijiFinlandFragile and conflict affected situationsFranceFrench PolynesiaGabonGambia, TheGeorgiaGermanyGhanaGibraltarGreeceGreenlandGrenadaGuamGuatemalaGuineaGuinea-BissauGuyanaHaitiHeavily indebted poor countries (HIPC)High incomeHondurasHong Kong SAR, ChinaHungaryIBRD onlyIcelandIDA & IBRD totalIDA blendIDA onlyIDA totalIndiaIndonesiaIran, Islamic Rep.IraqIrelandIsraelItalyJamaicaJapanJordanKazakhstanKenyaKiribatiKorea, Dem. People’s Rep.Korea, Rep.KosovoKuwaitKyrgyz RepublicLao PDRLate-demographic dividendLatin America & Caribbean Latin America & Caribbean (excluding high income)Latin America & the Caribbean (IDA & IBRD countries)LatviaLeast developed countries: UN classificationLebanonLiberiaLibyaLithuaniaLow & middle incomeLow incomeLower middle incomeLuxembourgMacao SAR, ChinaMacedonia, FYRMadagascarMalawiMalaysiaMaldivesMaliMaltaMauritaniaMauritiusMexicoMiddle East & North AfricaMiddle East & North Africa (excluding high income)Middle East & North Africa (IDA & IBRD countries)Middle incomeMoldovaMongoliaMontenegroMoroccoMozambiqueMyanmarNauruNepalNetherlandsNew CaledoniaNew ZealandNicaraguaNigerNigeriaNorth AmericaNorwayOECD membersOmanOther small statesPacific island small statesPakistanPanamaPapua New GuineaParaguayPeruPhilippinesPolandPortugalPost-demographic dividendPre-demographic dividendQatarRomaniaRussian FederationRwandaSamoaSao Tome and PrincipeSaudi ArabiaSenegalSerbiaSeychellesSierra LeoneSingaporeSlovak RepublicSloveniaSmall statesSolomon IslandsSomaliaSouth AfricaSouth AsiaSouth Asia (IDA & IBRD)SpainSri LankaSt. Kitts and NevisSt. LuciaSt. Vincent and the GrenadinesSub-Saharan Africa Sub-Saharan Africa (excluding high income)Sub-Saharan Africa (IDA & IBRD countries)SudanSurinameSwedenSwitzerlandSyrian Arab RepublicTajikistanTanzaniaThailandTogoTongaTrinidad and TobagoTunisiaTurkeyTurkmenistanTuvaluUgandaUkraineUnited Arab EmiratesUnited KingdomUnited StatesUpper middle incomeUruguayUzbekistanVanuatuVenezuela, RBVietnamWorldYemen, Rep.ZambiaZimbabwe Linha do tempo:
Nesta escala de tempo está apresentado um gráfico de 1961 ano até 2015 ano Tanzania. Dados de 1960 ano ausente. O número de observações reais por data: 55.
Fonte (nome):
Indicadores de desenvolvimento mundial
Fonte (organização):
World Bank staff estimates based data from International Monetary Fund's Direction of Trade database.
Categorias:
Private Sector, Trade
Foi atualizado:
23 abr 2017 ano
Indicadores de alterações dos valores ao longo dos anos
Mínimo:
31.175
1 jan 2014 ano
Máximo:
89.071
1 jan 1987 ano
Na data de observação
Valor
Mudança absoluta
A alteração em relação ao valor anterior
1 jan 1961 ano
81.323
+81.323
0.0%
1 jan 1962 ano
84.009
+2.686
3.3%
1 jan 1963 ano
81.411
-2.598
-3.09%
1 jan 1964 ano
79.22
-2.191
-2.69%
1 jan 1965 ano
80.719
+1.499
1.89%
1 jan 1966 ano
74.35
-6.368
-7.89%
1 jan 1967 ano
74.002
-0.349
-0.47%
1 jan 1968 ano
71.962
-2.04
-2.76%
1 jan 1969 ano
64.066
-7.896
-10.97%
1 jan 1970 ano
65.005
+0.939
1.47%
1 jan 1971 ano
65.629
+0.623
0.96%
1 jan 1972 ano
55.109
-10.52
-16.03%
1 jan 1973 ano
50.323
-4.786
-8.68%
1 jan 1974 ano
51.878
+1.555
3.09%
1 jan 1975 ano
55.642
+3.764
7.26%
1 jan 1976 ano
57.677
+2.035
3.66%
1 jan 1977 ano
71.753
+14.076
24.4%
1 jan 1978 ano
79.156
+7.403
10.32%
1 jan 1979 ano
76.567
-2.589
-3.27%
1 jan 1980 ano
66.167
-10.4
-13.58%
1 jan 1981 ano
62.374
-3.792
-5.73%
1 jan 1982 ano
65.779
+3.405
5.46%
1 jan 1983 ano
75.721
+9.942
15.11%
1 jan 1984 ano
75.465
-0.256
-0.34%
1 jan 1985 ano
77.806
+2.34
3.1%
1 jan 1986 ano
77.488
-0.318
-0.41%
1 jan 1987 ano
89.071
+11.583
14.95%
1 jan 1988 ano
80.451
-8.619
-9.68%
1 jan 1989 ano
85.584
+5.133
6.38%
1 jan 1990 ano
78.31
-7.274
-8.5%
1 jan 1991 ano
62.786
-15.524
-19.82%
1 jan 1992 ano
64.402
+1.615
2.57%
1 jan 1993 ano
57.202
-7.2
-11.18%
1 jan 1994 ano
57.23
+0.028
0.05%
1 jan 1995 ano
56.348
-0.882
-1.54%
1 jan 1996 ano
58.498
+2.15
3.82%
1 jan 1997 ano
51.605
-6.893
-11.78%
1 jan 1998 ano
57.597
+5.992
11.61%
1 jan 1999 ano
59.942
+2.345
4.07%
1 jan 2000 ano
56.976
-2.966
-4.95%
1 jan 2001 ano
63.306
+6.33
11.11%
1 jan 2002 ano
72.845
+9.539
15.07%
1 jan 2003 ano
68.997
-3.848
-5.28%
1 jan 2004 ano
55.719
-13.278
-19.24%
1 jan 2005 ano
52.954
-2.765
-4.96%
1 jan 2006 ano
48.864
-4.09
-7.72%
1 jan 2007 ano
48.346
-0.519
-1.06%
1 jan 2008 ano
44.303
-4.043
-8.36%
1 jan 2009 ano
43.646
-0.657
-1.48%
1 jan 2010 ano
43.389
-0.257
-0.59%
1 jan 2011 ano
36.513
-6.875
-15.85%
1 jan 2012 ano
40.479
+3.966
10.86%
1 jan 2013 ano
36.852
-3.627
-8.96%
1 jan 2014 ano
31.175
-5.677
-15.41%
1 jan 2015 ano
34.389
+3.214
10.31%
Classificação de países por estatísticas atuais por anos


Comentários: