29
/pt/
pt
AIzaSyAYiBZKx7MnpbEhh9jyipgxe19OcubqV5w
April 1, 2024
203190
Mozambique
MOZ
true
2
1
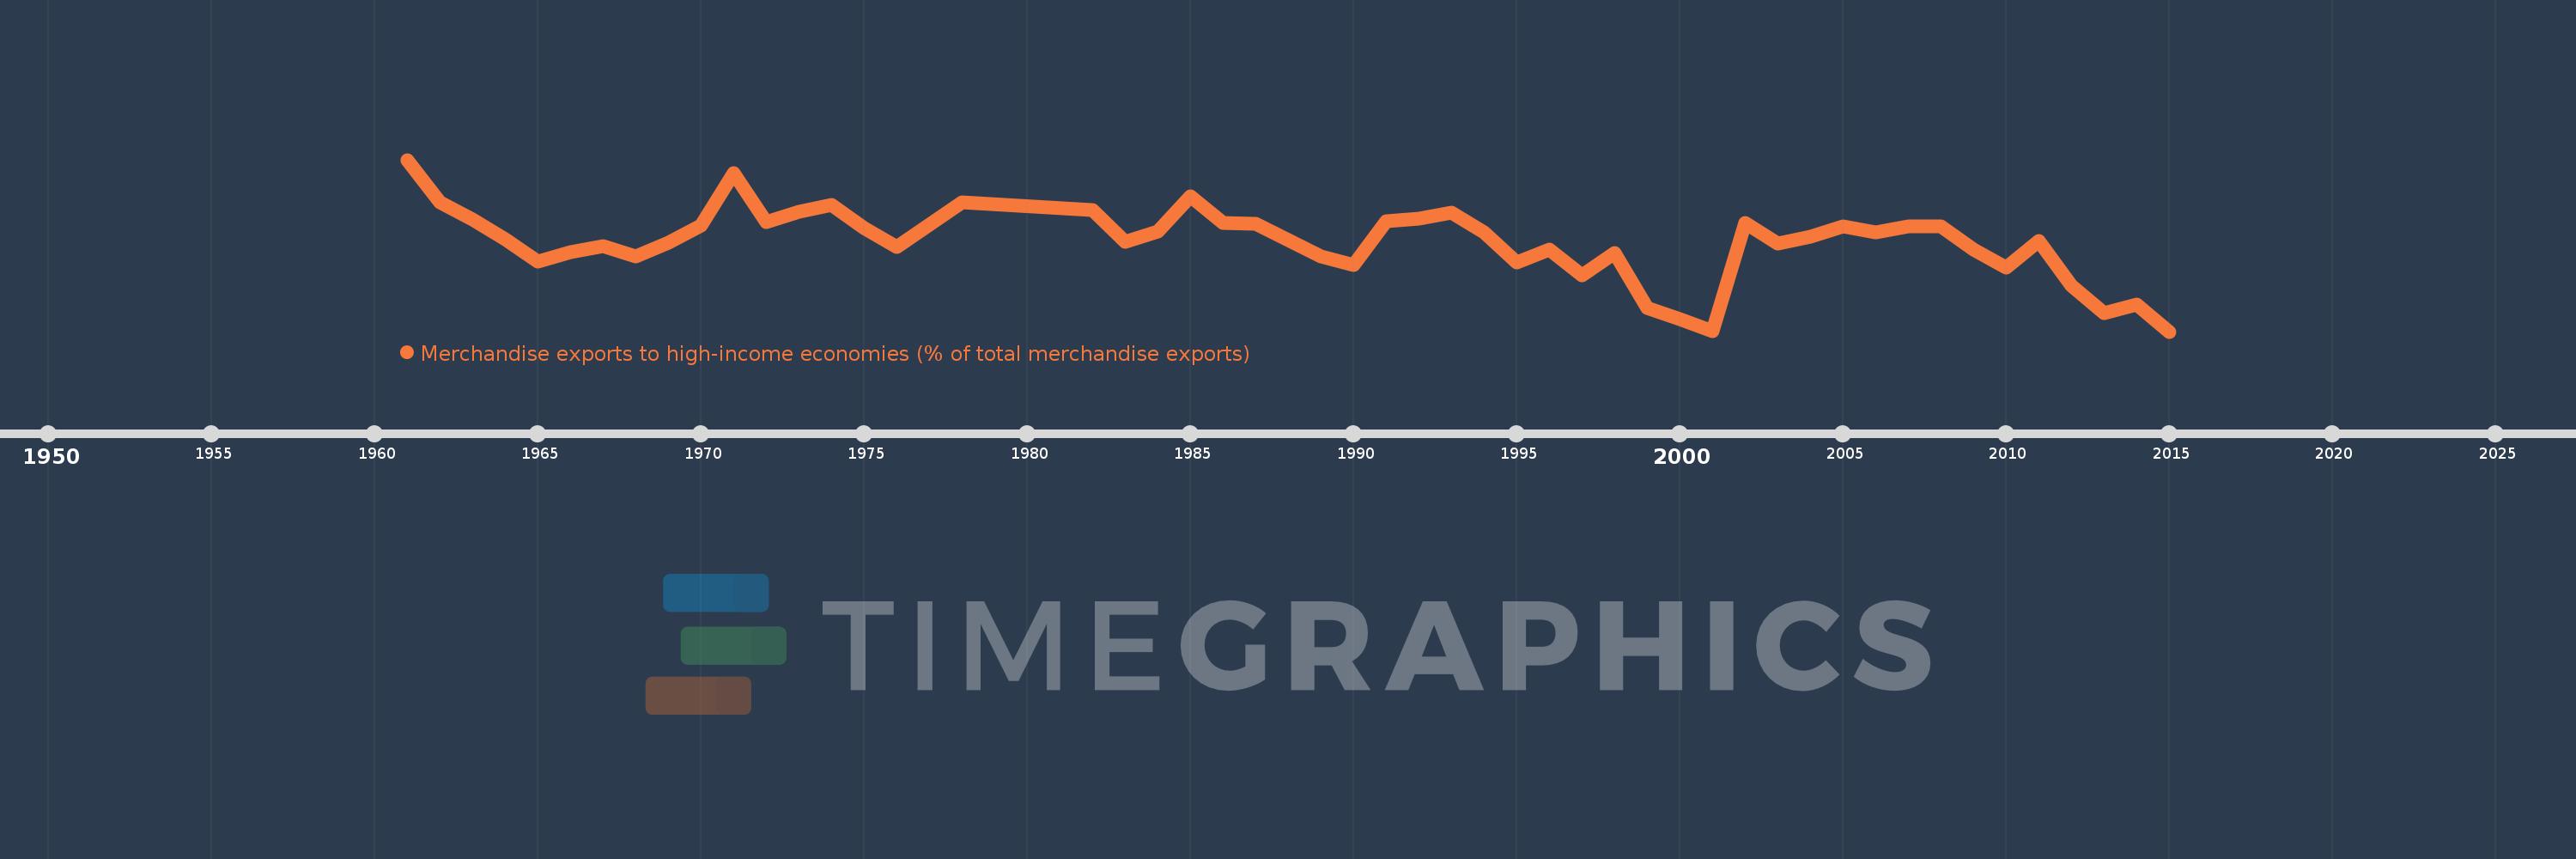
Merchandise exports to high-income economies (% of total merchandise exports)
2015,2014,2013,2012,2011,2010,2009,2008,2007,2006,2005,2004,2003,2002,2001,2000,1999,1998,1997,1996,1995,1994,1993,1992,1991,1990,1989,1988,1987,1986,1985,1984,1983,1982,1978,1976,1975,1974,1973,1972,1971,1970,1969,1968,1967,1966,1965,1964,1963,1962,1961
Estas estatísticas em outros países:
AfghanistanAlbaniaAlgeriaAmerican SamoaAngolaAntigua and BarbudaArab WorldArgentinaArmeniaArubaAustraliaAustriaAzerbaijanBahamas, TheBahrainBangladeshBarbadosBelarusBelgiumBelizeBeninBermudaBoliviaBosnia and HerzegovinaBrazilBrunei DarussalamBulgariaBurkina FasoBurundiCabo VerdeCambodiaCameroonCanadaCaribbean small statesCentral African RepublicCentral Europe and the BalticsChadChileChinaColombiaComorosCongo, Dem. Rep.Congo, Rep.Costa RicaCote d'IvoireCroatiaCubaCyprusCzech RepublicDenmarkDjiboutiDominicaDominican RepublicEarly-demographic dividendEast Asia & PacificEast Asia & Pacific (excluding high income)East Asia & Pacific (IDA & IBRD countries)EcuadorEgypt, Arab Rep.El SalvadorEquatorial GuineaEstoniaEthiopiaEuro areaEurope & Central AsiaEurope & Central Asia (excluding high income)Europe & Central Asia (IDA & IBRD countries)European UnionFaroe IslandsFijiFinlandFragile and conflict affected situationsFranceFrench PolynesiaGabonGambia, TheGeorgiaGermanyGhanaGibraltarGreeceGreenlandGrenadaGuamGuatemalaGuineaGuinea-BissauGuyanaHaitiHeavily indebted poor countries (HIPC)High incomeHondurasHong Kong SAR, ChinaHungaryIBRD onlyIcelandIDA & IBRD totalIDA blendIDA onlyIDA totalIndiaIndonesiaIran, Islamic Rep.IraqIrelandIsraelItalyJamaicaJapanJordanKazakhstanKenyaKiribatiKorea, Dem. People’s Rep.Korea, Rep.KosovoKuwaitKyrgyz RepublicLao PDRLate-demographic dividendLatin America & Caribbean Latin America & Caribbean (excluding high income)Latin America & the Caribbean (IDA & IBRD countries)LatviaLeast developed countries: UN classificationLebanonLiberiaLibyaLithuaniaLow & middle incomeLow incomeLower middle incomeLuxembourgMacao SAR, ChinaMacedonia, FYRMadagascarMalawiMalaysiaMaldivesMaliMaltaMauritaniaMauritiusMexicoMiddle East & North AfricaMiddle East & North Africa (excluding high income)Middle East & North Africa (IDA & IBRD countries)Middle incomeMoldovaMongoliaMontenegroMoroccoMozambiqueMyanmarNauruNepalNetherlandsNew CaledoniaNew ZealandNicaraguaNigerNigeriaNorth AmericaNorwayOECD membersOmanOther small statesPacific island small statesPakistanPanamaPapua New GuineaParaguayPeruPhilippinesPolandPortugalPost-demographic dividendPre-demographic dividendQatarRomaniaRussian FederationRwandaSamoaSao Tome and PrincipeSaudi ArabiaSenegalSerbiaSeychellesSierra LeoneSingaporeSlovak RepublicSloveniaSmall statesSolomon IslandsSomaliaSouth AfricaSouth AsiaSouth Asia (IDA & IBRD)SpainSri LankaSt. Kitts and NevisSt. LuciaSt. Vincent and the GrenadinesSub-Saharan Africa Sub-Saharan Africa (excluding high income)Sub-Saharan Africa (IDA & IBRD countries)SudanSurinameSwedenSwitzerlandSyrian Arab RepublicTajikistanTanzaniaThailandTogoTongaTrinidad and TobagoTunisiaTurkeyTurkmenistanTuvaluUgandaUkraineUnited Arab EmiratesUnited KingdomUnited StatesUpper middle incomeUruguayUzbekistanVanuatuVenezuela, RBVietnamWorldYemen, Rep.ZambiaZimbabwe Linha do tempo:
Nesta escala de tempo está apresentado um gráfico de 1961 ano até 2015 ano Mozambique. Dados de 1960 ano ausente. O número de observações reais por data: 51.
Fonte (nome):
Indicadores de desenvolvimento mundial
Fonte (organização):
World Bank staff estimates based data from International Monetary Fund's Direction of Trade database.
Categorias:
Private Sector, Trade
Foi atualizado:
23 abr 2017 ano
Indicadores de alterações dos valores ao longo dos anos
Mínimo:
36.618
1 jan 2015 ano
Máximo:
90.016
1 jan 1961 ano
Na data de observação
Valor
Mudança absoluta
A alteração em relação ao valor anterior
1 jan 1961 ano
90.016
+90.016
0.0%
1 jan 1962 ano
76.85
-13.166
-14.63%
1 jan 1963 ano
71.328
-5.522
-7.19%
1 jan 1964 ano
65.217
-6.11
-8.57%
1 jan 1965 ano
58.483
-6.734
-10.33%
1 jan 1966 ano
61.323
+2.84
4.86%
1 jan 1967 ano
63.115
+1.792
2.92%
1 jan 1968 ano
59.937
-3.178
-5.04%
1 jan 1969 ano
64.206
+4.269
7.12%
1 jan 1970 ano
69.527
+5.32
8.29%
1 jan 1971 ano
85.749
+16.222
23.33%
1 jan 1972 ano
70.675
-15.074
-17.58%
1 jan 1973 ano
73.776
+3.101
4.39%
1 jan 1974 ano
75.965
+2.188
2.97%
1 jan 1975 ano
68.696
-7.269
-9.57%
1 jan 1976 ano
62.823
-5.872
-8.55%
1 jan 1978 ano
76.857
+14.034
22.34%
1 jan 1982 ano
74.306
-2.551
-3.32%
1 jan 1983 ano
64.441
-9.865
-13.28%
1 jan 1984 ano
67.849
+3.408
5.29%
1 jan 1985 ano
78.548
+10.698
15.77%
1 jan 1986 ano
70.26
-8.288
-10.55%
1 jan 1987 ano
70.189
-0.071
-0.1%
1 jan 1988 ano
65.141
-5.048
-7.19%
1 jan 1989 ano
60.011
-5.13
-7.88%
1 jan 1990 ano
57.228
-2.783
-4.64%
1 jan 1991 ano
70.959
+13.731
23.99%
1 jan 1992 ano
71.794
+0.835
1.18%
1 jan 1993 ano
73.487
+1.693
2.36%
1 jan 1994 ano
67.499
-5.987
-8.15%
1 jan 1995 ano
58.006
-9.493
-14.06%
1 jan 1996 ano
62.156
+4.15
7.15%
1 jan 1997 ano
54.052
-8.103
-13.04%
1 jan 1998 ano
61.031
+6.979
12.91%
1 jan 1999 ano
44.054
-16.977
-27.82%
1 jan 2000 ano
40.59
-3.464
-7.86%
1 jan 2001 ano
36.67
-3.921
-9.66%
1 jan 2002 ano
70.475
+33.805
92.19%
1 jan 2003 ano
63.852
-6.623
-9.4%
1 jan 2004 ano
66.066
+2.214
3.47%
1 jan 2005 ano
69.443
+3.377
5.11%
1 jan 2006 ano
67.542
-1.901
-2.74%
1 jan 2007 ano
69.225
+1.683
2.49%
1 jan 2008 ano
69.248
+0.023
0.03%
1 jan 2009 ano
62.057
-7.19
-10.38%
1 jan 2010 ano
56.607
-5.45
-8.78%
1 jan 2011 ano
64.722
+8.115
14.34%
1 jan 2012 ano
50.853
-13.869
-21.43%
1 jan 2013 ano
42.473
-8.38
-16.48%
1 jan 2014 ano
45.027
+2.554
6.01%
1 jan 2015 ano
36.618
-8.408
-18.67%
Classificação de países por estatísticas atuais por anos


Comentários: