29
/pt/
pt
AIzaSyAYiBZKx7MnpbEhh9jyipgxe19OcubqV5w
April 1, 2024
122413
Dominican Republic
DOM
true
2
1
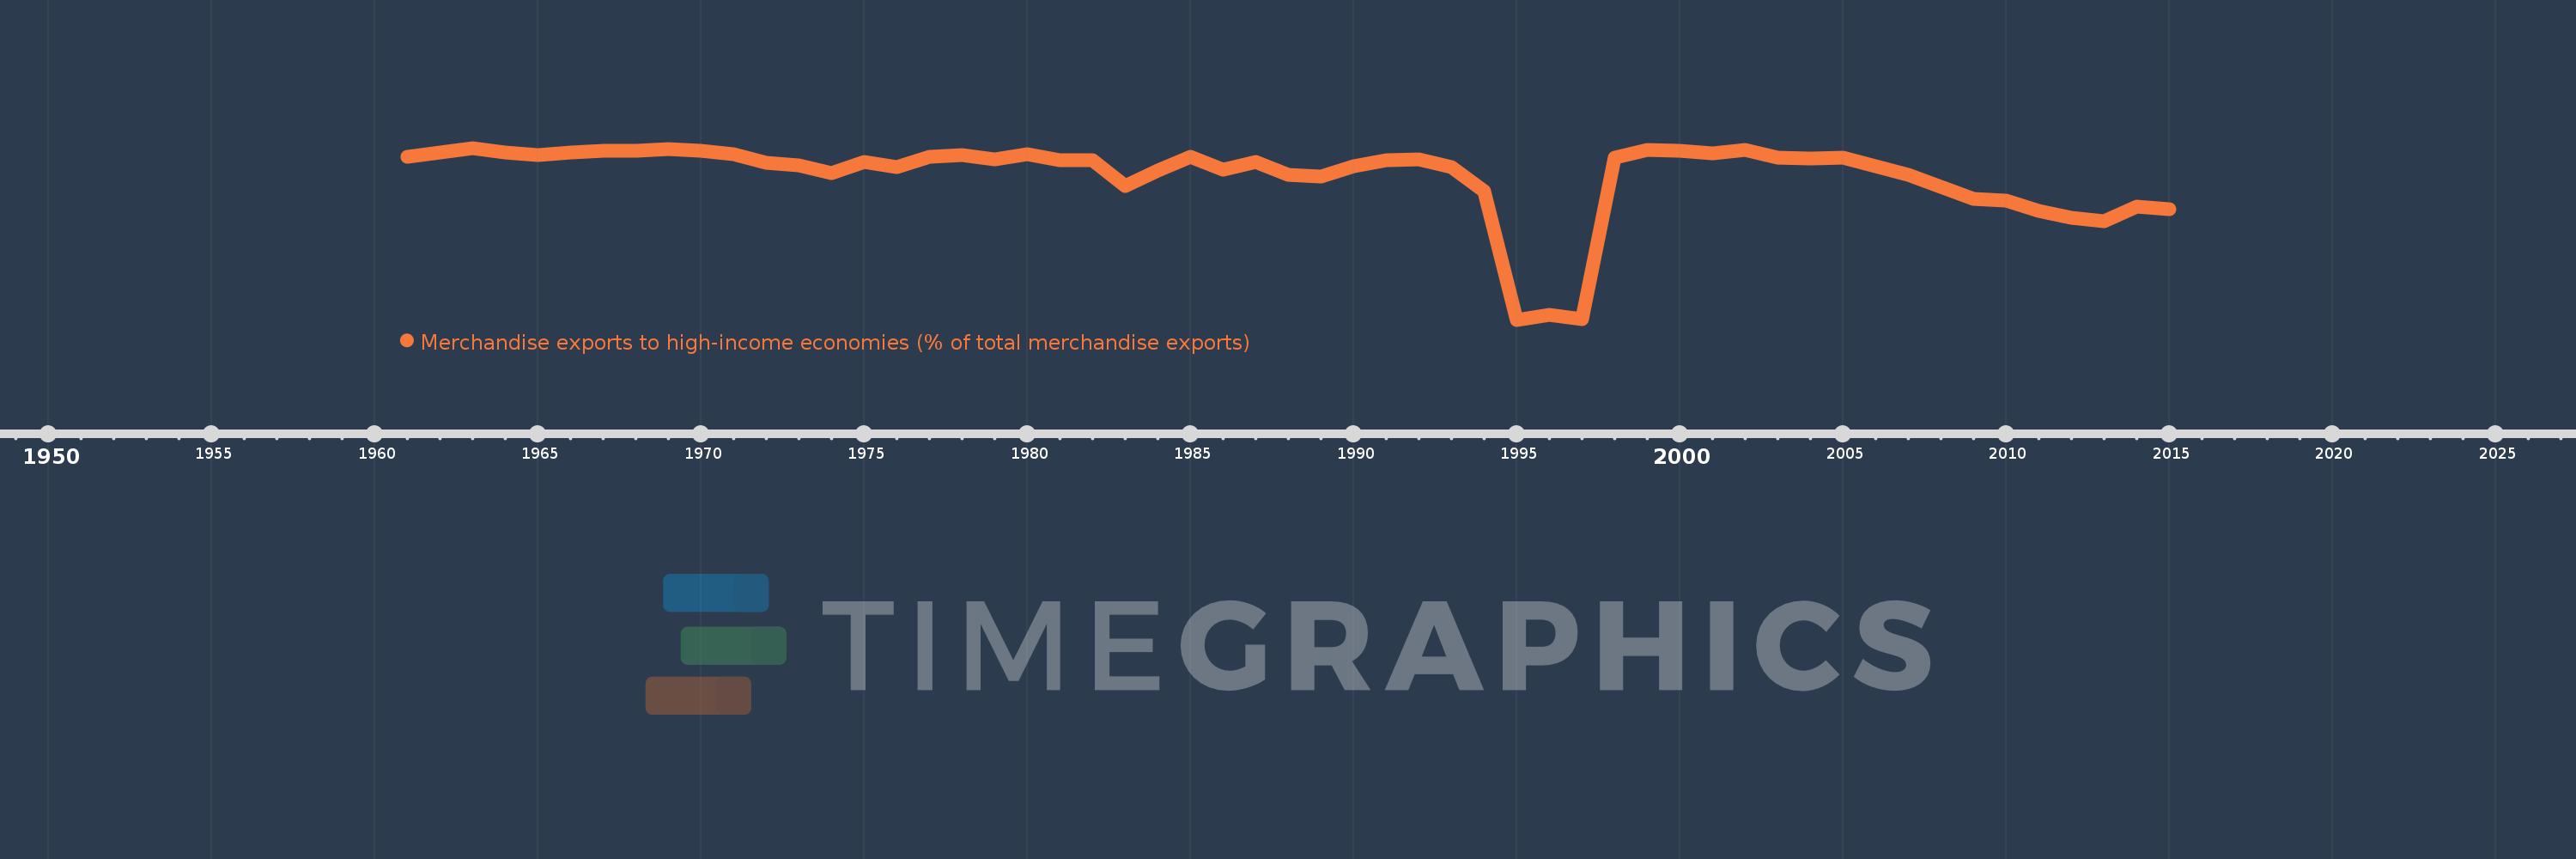
Merchandise exports to high-income economies (% of total merchandise exports)
2015,2014,2013,2012,2011,2010,2009,2008,2007,2006,2005,2004,2003,2002,2001,2000,1999,1998,1997,1996,1995,1994,1993,1992,1991,1990,1989,1988,1987,1986,1985,1984,1983,1982,1981,1980,1979,1978,1977,1976,1975,1974,1973,1972,1971,1970,1969,1968,1967,1966,1965,1964,1963,1962,1961
Estas estatísticas em outros países:
AfghanistanAlbaniaAlgeriaAmerican SamoaAngolaAntigua and BarbudaArab WorldArgentinaArmeniaArubaAustraliaAustriaAzerbaijanBahamas, TheBahrainBangladeshBarbadosBelarusBelgiumBelizeBeninBermudaBoliviaBosnia and HerzegovinaBrazilBrunei DarussalamBulgariaBurkina FasoBurundiCabo VerdeCambodiaCameroonCanadaCaribbean small statesCentral African RepublicCentral Europe and the BalticsChadChileChinaColombiaComorosCongo, Dem. Rep.Congo, Rep.Costa RicaCote d'IvoireCroatiaCubaCyprusCzech RepublicDenmarkDjiboutiDominicaDominican RepublicEarly-demographic dividendEast Asia & PacificEast Asia & Pacific (excluding high income)East Asia & Pacific (IDA & IBRD countries)EcuadorEgypt, Arab Rep.El SalvadorEquatorial GuineaEstoniaEthiopiaEuro areaEurope & Central AsiaEurope & Central Asia (excluding high income)Europe & Central Asia (IDA & IBRD countries)European UnionFaroe IslandsFijiFinlandFragile and conflict affected situationsFranceFrench PolynesiaGabonGambia, TheGeorgiaGermanyGhanaGibraltarGreeceGreenlandGrenadaGuamGuatemalaGuineaGuinea-BissauGuyanaHaitiHeavily indebted poor countries (HIPC)High incomeHondurasHong Kong SAR, ChinaHungaryIBRD onlyIcelandIDA & IBRD totalIDA blendIDA onlyIDA totalIndiaIndonesiaIran, Islamic Rep.IraqIrelandIsraelItalyJamaicaJapanJordanKazakhstanKenyaKiribatiKorea, Dem. People’s Rep.Korea, Rep.KosovoKuwaitKyrgyz RepublicLao PDRLate-demographic dividendLatin America & Caribbean Latin America & Caribbean (excluding high income)Latin America & the Caribbean (IDA & IBRD countries)LatviaLeast developed countries: UN classificationLebanonLiberiaLibyaLithuaniaLow & middle incomeLow incomeLower middle incomeLuxembourgMacao SAR, ChinaMacedonia, FYRMadagascarMalawiMalaysiaMaldivesMaliMaltaMauritaniaMauritiusMexicoMiddle East & North AfricaMiddle East & North Africa (excluding high income)Middle East & North Africa (IDA & IBRD countries)Middle incomeMoldovaMongoliaMontenegroMoroccoMozambiqueMyanmarNauruNepalNetherlandsNew CaledoniaNew ZealandNicaraguaNigerNigeriaNorth AmericaNorwayOECD membersOmanOther small statesPacific island small statesPakistanPanamaPapua New GuineaParaguayPeruPhilippinesPolandPortugalPost-demographic dividendPre-demographic dividendQatarRomaniaRussian FederationRwandaSamoaSao Tome and PrincipeSaudi ArabiaSenegalSerbiaSeychellesSierra LeoneSingaporeSlovak RepublicSloveniaSmall statesSolomon IslandsSomaliaSouth AfricaSouth AsiaSouth Asia (IDA & IBRD)SpainSri LankaSt. Kitts and NevisSt. LuciaSt. Vincent and the GrenadinesSub-Saharan Africa Sub-Saharan Africa (excluding high income)Sub-Saharan Africa (IDA & IBRD countries)SudanSurinameSwedenSwitzerlandSyrian Arab RepublicTajikistanTanzaniaThailandTogoTongaTrinidad and TobagoTunisiaTurkeyTurkmenistanTuvaluUgandaUkraineUnited Arab EmiratesUnited KingdomUnited StatesUpper middle incomeUruguayUzbekistanVanuatuVenezuela, RBVietnamWorldYemen, Rep.ZambiaZimbabwe Linha do tempo:
Nesta escala de tempo está apresentado um gráfico de 1961 ano até 2015 ano Dominican Republic. Dados de 1960 ano ausente. O número de observações reais por data: 55.
Fonte (nome):
Indicadores de desenvolvimento mundial
Fonte (organização):
World Bank staff estimates based data from International Monetary Fund's Direction of Trade database.
Categorias:
Private Sector, Trade
Foi atualizado:
23 abr 2017 ano
Indicadores de alterações dos valores ao longo dos anos
Mínimo:
15.476
1 jan 1995 ano
Máximo:
97.784
1 jan 1963 ano
Na data de observação
Valor
Mudança absoluta
A alteração em relação ao valor anterior
1 jan 1961 ano
93.507
+93.507
0.0%
1 jan 1962 ano
95.769
+2.261
2.42%
1 jan 1963 ano
97.784
+2.015
2.1%
1 jan 1964 ano
95.615
-2.169
-2.22%
1 jan 1965 ano
94.4
-1.215
-1.27%
1 jan 1966 ano
95.468
+1.068
1.13%
1 jan 1967 ano
96.523
+1.055
1.11%
1 jan 1968 ano
96.533
+0.01
0.01%
1 jan 1969 ano
97.126
+0.593
0.61%
1 jan 1970 ano
96.342
-0.784
-0.81%
1 jan 1971 ano
94.606
-1.736
-1.8%
1 jan 1972 ano
90.672
-3.934
-4.16%
1 jan 1973 ano
89.59
-1.082
-1.19%
1 jan 1974 ano
85.893
-3.697
-4.13%
1 jan 1975 ano
90.892
+4.999
5.82%
1 jan 1976 ano
88.46
-2.432
-2.68%
1 jan 1977 ano
93.482
+5.022
5.68%
1 jan 1978 ano
94.427
+0.945
1.01%
1 jan 1979 ano
92.311
-2.116
-2.24%
1 jan 1980 ano
94.815
+2.504
2.71%
1 jan 1981 ano
91.791
-3.024
-3.19%
1 jan 1982 ano
92.098
+0.307
0.33%
1 jan 1983 ano
79.691
-12.407
-13.47%
1 jan 1984 ano
87.035
+7.344
9.22%
1 jan 1985 ano
93.514
+6.479
7.44%
1 jan 1986 ano
87.277
-6.237
-6.67%
1 jan 1987 ano
91.072
+3.795
4.35%
1 jan 1988 ano
84.781
-6.291
-6.91%
1 jan 1989 ano
84.062
-0.719
-0.85%
1 jan 1990 ano
89.022
+4.96
5.9%
1 jan 1991 ano
91.877
+2.855
3.21%
1 jan 1992 ano
92.479
+0.602
0.66%
1 jan 1993 ano
88.532
-3.947
-4.27%
1 jan 1994 ano
77.076
-11.456
-12.94%
1 jan 1995 ano
15.476
-61.6
-79.92%
1 jan 1996 ano
17.861
+2.385
15.41%
1 jan 1997 ano
15.76
-2.101
-11.76%
1 jan 1998 ano
93.254
+77.494
491.7%
1 jan 1999 ano
96.797
+3.542
3.8%
1 jan 2000 ano
96.573
-0.223
-0.23%
1 jan 2001 ano
95.352
-1.221
-1.26%
1 jan 2002 ano
96.716
+1.364
1.43%
1 jan 2003 ano
93.308
-3.409
-3.52%
1 jan 2004 ano
92.872
-0.436
-0.47%
1 jan 2005 ano
92.962
+0.09
0.1%
1 jan 2006 ano
88.885
-4.077
-4.39%
1 jan 2007 ano
84.79
-4.095
-4.61%
1 jan 2008 ano
78.94
-5.849
-6.9%
1 jan 2009 ano
73.457
-5.483
-6.95%
1 jan 2010 ano
72.369
-1.088
-1.48%
1 jan 2011 ano
67.788
-4.581
-6.33%
1 jan 2012 ano
64.419
-3.369
-4.97%
1 jan 2013 ano
62.856
-1.563
-2.43%
1 jan 2014 ano
69.516
+6.66
10.6%
1 jan 2015 ano
68.508
-1.007
-1.45%
Classificação de países por estatísticas atuais por anos


Comentários: