29
/pt/
pt
AIzaSyAYiBZKx7MnpbEhh9jyipgxe19OcubqV5w
April 1, 2024
277357
Uruguay
URY
true
2
1
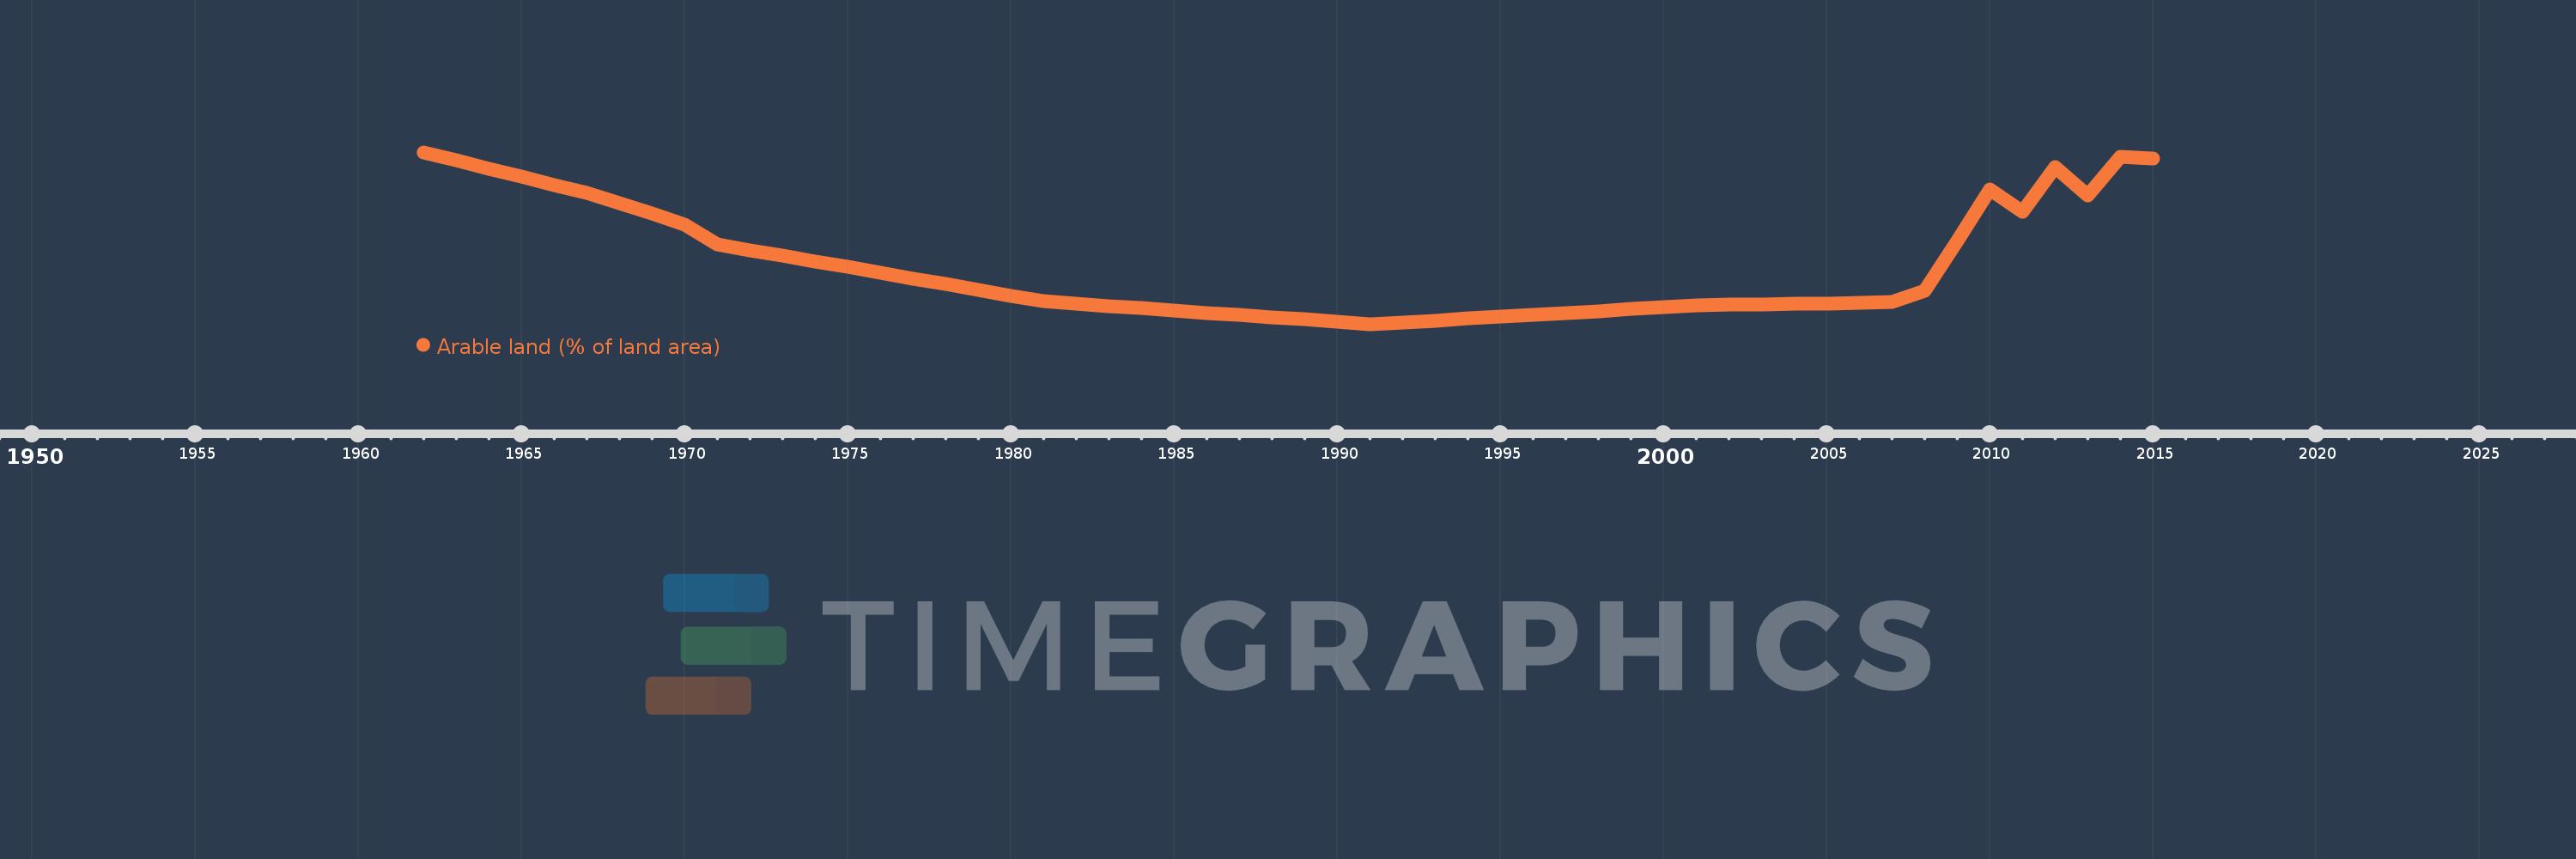
Arable land (% of land area)
2015,2014,2013,2012,2011,2010,2009,2008,2007,2006,2005,2004,2003,2002,2001,2000,1999,1998,1997,1996,1995,1994,1993,1992,1991,1990,1989,1988,1987,1986,1985,1984,1983,1982,1981,1980,1979,1978,1977,1976,1975,1974,1973,1972,1971,1970,1969,1968,1967,1966,1965,1964,1963,1962
Estas estatísticas em outros países:
AfghanistanAlbaniaAlgeriaAmerican SamoaAndorraAngolaAntigua and BarbudaArab WorldArgentinaArmeniaArubaAustraliaAustriaAzerbaijanBahamas, TheBahrainBangladeshBarbadosBelarusBelgiumBelizeBeninBermudaBhutanBoliviaBosnia and HerzegovinaBotswanaBrazilBritish Virgin IslandsBrunei DarussalamBulgariaBurkina FasoBurundiCabo VerdeCambodiaCameroonCanadaCaribbean small statesCayman IslandsCentral African RepublicCentral Europe and the BalticsChadChannel IslandsChileChinaColombiaComorosCongo, Dem. Rep.Congo, Rep.Costa RicaCote d'IvoireCroatiaCubaCyprusCzech RepublicDenmarkDjiboutiDominicaDominican RepublicEarly-demographic dividendEast Asia & PacificEast Asia & Pacific (excluding high income)East Asia & Pacific (IDA & IBRD countries)EcuadorEgypt, Arab Rep.El SalvadorEquatorial GuineaEritreaEstoniaEthiopiaEuro areaEurope & Central AsiaEurope & Central Asia (excluding high income)Europe & Central Asia (IDA & IBRD countries)European UnionFaroe IslandsFijiFinlandFragile and conflict affected situationsFranceFrench PolynesiaGabonGambia, TheGeorgiaGermanyGhanaGreeceGreenlandGrenadaGuamGuatemalaGuineaGuinea-BissauGuyanaHaitiHeavily indebted poor countries (HIPC)High incomeHondurasHong Kong SAR, ChinaHungaryIBRD onlyIcelandIDA & IBRD totalIDA blendIDA onlyIDA totalIndiaIndonesiaIran, Islamic Rep.IraqIrelandIsle of ManIsraelItalyJamaicaJapanJordanKazakhstanKenyaKiribatiKorea, Dem. People’s Rep.Korea, Rep.KosovoKuwaitKyrgyz RepublicLao PDRLate-demographic dividendLatin America & Caribbean Latin America & Caribbean (excluding high income)Latin America & the Caribbean (IDA & IBRD countries)LatviaLeast developed countries: UN classificationLebanonLesothoLiberiaLibyaLiechtensteinLithuaniaLow & middle incomeLow incomeLower middle incomeLuxembourgMacedonia, FYRMadagascarMalawiMalaysiaMaldivesMaliMaltaMarshall IslandsMauritaniaMauritiusMexicoMicronesia, Fed. Sts.Middle East & North AfricaMiddle East & North Africa (excluding high income)Middle East & North Africa (IDA & IBRD countries)Middle incomeMoldovaMongoliaMontenegroMoroccoMozambiqueMyanmarNamibiaNepalNetherlandsNew CaledoniaNew ZealandNicaraguaNigerNigeriaNorth AmericaNorthern Mariana IslandsNorwayOECD membersOmanOther small statesPacific island small statesPakistanPalauPanamaPapua New GuineaParaguayPeruPhilippinesPolandPortugalPost-demographic dividendPre-demographic dividendPuerto RicoQatarRomaniaRussian FederationRwandaSamoaSan MarinoSao Tome and PrincipeSaudi ArabiaSenegalSerbiaSeychellesSierra LeoneSingaporeSlovak RepublicSloveniaSmall statesSolomon IslandsSomaliaSouth AfricaSouth AsiaSouth Asia (IDA & IBRD)SpainSri LankaSt. Kitts and NevisSt. LuciaSt. Vincent and the GrenadinesSub-Saharan Africa Sub-Saharan Africa (excluding high income)Sub-Saharan Africa (IDA & IBRD countries)SudanSurinameSwazilandSwedenSwitzerlandSyrian Arab RepublicTajikistanTanzaniaThailandTimor-LesteTogoTongaTrinidad and TobagoTunisiaTurkeyTurkmenistanTurks and Caicos IslandsUgandaUkraineUnited Arab EmiratesUnited KingdomUnited StatesUpper middle incomeUruguayUzbekistanVanuatuVenezuela, RBVietnamVirgin Islands (U.S.)West Bank and GazaWorldYemen, Rep.ZambiaZimbabwe Linha do tempo:
Nesta escala de tempo está apresentado um gráfico de 1962 ano até 2015 ano Uruguay. Dados de 1961 ano ausente. O número de observações reais por data: 54.
Fonte (nome):
Indicadores de desenvolvimento mundial
Fonte (organização):
Food and Agriculture Organization, electronic files and web site.
Categorias:
Agriculture & Rural Development, Climate Change, Environment
Foi atualizado:
23 abr 2017 ano
Indicadores de alterações dos valores ao longo dos anos
Mínimo:
7.091
1 jan 1991 ano
Máximo:
14.021
1 jan 1962 ano
Na data de observação
Valor
Mudança absoluta
A alteração em relação ao valor anterior
1 jan 1962 ano
14.021
+14.021
0.0%
1 jan 1963 ano
13.69
-0.331
-2.36%
1 jan 1964 ano
13.358
-0.331
-2.42%
1 jan 1965 ano
13.033
-0.326
-2.44%
1 jan 1966 ano
12.701
-0.331
-2.54%
1 jan 1967 ano
12.376
-0.326
-2.56%
1 jan 1968 ano
11.959
-0.417
-3.37%
1 jan 1969 ano
11.542
-0.417
-3.49%
1 jan 1970 ano
11.119
-0.423
-3.66%
1 jan 1971 ano
10.307
-0.811
-7.3%
1 jan 1972 ano
10.079
-0.229
-2.22%
1 jan 1973 ano
9.845
-0.234
-2.32%
1 jan 1974 ano
9.622
-0.223
-2.26%
1 jan 1975 ano
9.393
-0.229
-2.38%
1 jan 1976 ano
9.165
-0.229
-2.43%
1 jan 1977 ano
8.936
-0.229
-2.49%
1 jan 1978 ano
8.708
-0.229
-2.56%
1 jan 1979 ano
8.479
-0.229
-2.62%
1 jan 1980 ano
8.245
-0.234
-2.76%
1 jan 1981 ano
8.016
-0.229
-2.77%
1 jan 1982 ano
7.925
-0.091
-1.14%
1 jan 1983 ano
7.828
-0.097
-1.23%
1 jan 1984 ano
7.736
-0.091
-1.17%
1 jan 1985 ano
7.645
-0.091
-1.18%
1 jan 1986 ano
7.553
-0.091
-1.2%
1 jan 1987 ano
7.473
-0.08
-1.06%
1 jan 1988 ano
7.376
-0.097
-1.3%
1 jan 1989 ano
7.285
-0.091
-1.24%
1 jan 1990 ano
7.182
-0.103
-1.41%
1 jan 1991 ano
7.091
-0.091
-1.27%
1 jan 1992 ano
7.165
+0.074
1.05%
1 jan 1993 ano
7.239
+0.074
1.04%
1 jan 1994 ano
7.313
+0.074
1.03%
1 jan 1995 ano
7.388
+0.074
1.02%
1 jan 1996 ano
7.462
+0.074
1.01%
1 jan 1997 ano
7.536
+0.074
1.0%
1 jan 1998 ano
7.616
+0.08
1.06%
1 jan 1999 ano
7.696
+0.08
1.05%
1 jan 2000 ano
7.776
+0.08
1.04%
1 jan 2001 ano
7.845
+0.069
0.88%
1 jan 2002 ano
7.868
+0.023
0.29%
1 jan 2003 ano
7.891
+0.023
0.29%
1 jan 2004 ano
7.913
+0.023
0.29%
1 jan 2005 ano
7.936
+0.023
0.29%
1 jan 2006 ano
7.953
+0.017
0.22%
1 jan 2007 ano
7.976
+0.023
0.29%
1 jan 2008 ano
8.433
+0.457
5.73%
1 jan 2009 ano
10.433
+2.0
23.71%
1 jan 2010 ano
12.541
+2.108
20.21%
1 jan 2011 ano
11.616
-0.926
-7.38%
1 jan 2012 ano
13.438
+1.823
15.69%
1 jan 2013 ano
12.301
-1.137
-8.46%
1 jan 2014 ano
13.85
+1.548
12.59%
1 jan 2015 ano
13.773
-0.077
-0.55%
Classificação de países por estatísticas atuais por anos


Comentários: