29
/pt/
pt
AIzaSyAYiBZKx7MnpbEhh9jyipgxe19OcubqV5w
April 1, 2024
258016
Syrian Arab Republic
SYR
true
2
1
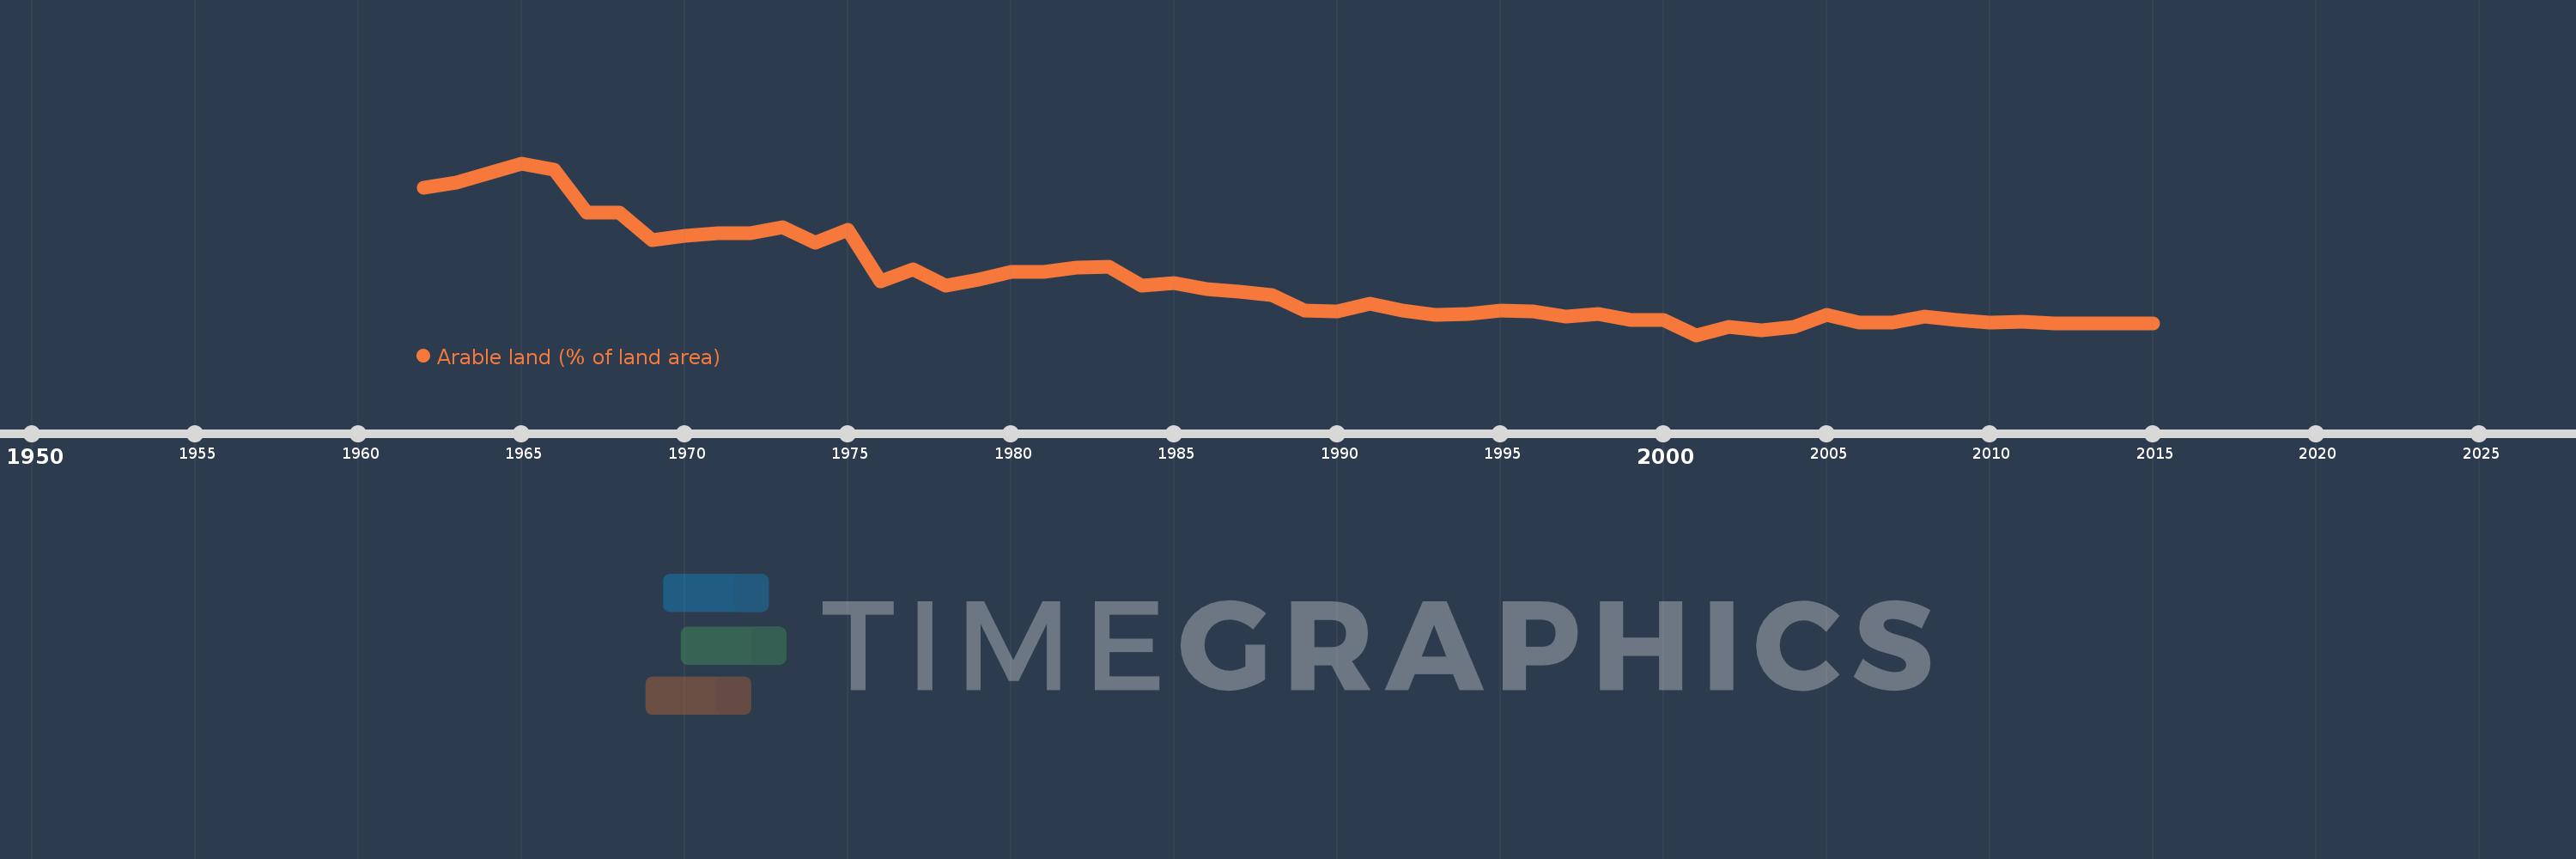
Arable land (% of land area)
2015,2014,2013,2012,2011,2010,2009,2008,2007,2006,2005,2004,2003,2002,2001,2000,1999,1998,1997,1996,1995,1994,1993,1992,1991,1990,1989,1988,1987,1986,1985,1984,1983,1982,1981,1980,1979,1978,1977,1976,1975,1974,1973,1972,1971,1970,1969,1968,1967,1966,1965,1964,1963,1962
Estas estatísticas em outros países:
AfghanistanAlbaniaAlgeriaAmerican SamoaAndorraAngolaAntigua and BarbudaArab WorldArgentinaArmeniaArubaAustraliaAustriaAzerbaijanBahamas, TheBahrainBangladeshBarbadosBelarusBelgiumBelizeBeninBermudaBhutanBoliviaBosnia and HerzegovinaBotswanaBrazilBritish Virgin IslandsBrunei DarussalamBulgariaBurkina FasoBurundiCabo VerdeCambodiaCameroonCanadaCaribbean small statesCayman IslandsCentral African RepublicCentral Europe and the BalticsChadChannel IslandsChileChinaColombiaComorosCongo, Dem. Rep.Congo, Rep.Costa RicaCote d'IvoireCroatiaCubaCyprusCzech RepublicDenmarkDjiboutiDominicaDominican RepublicEarly-demographic dividendEast Asia & PacificEast Asia & Pacific (excluding high income)East Asia & Pacific (IDA & IBRD countries)EcuadorEgypt, Arab Rep.El SalvadorEquatorial GuineaEritreaEstoniaEthiopiaEuro areaEurope & Central AsiaEurope & Central Asia (excluding high income)Europe & Central Asia (IDA & IBRD countries)European UnionFaroe IslandsFijiFinlandFragile and conflict affected situationsFranceFrench PolynesiaGabonGambia, TheGeorgiaGermanyGhanaGreeceGreenlandGrenadaGuamGuatemalaGuineaGuinea-BissauGuyanaHaitiHeavily indebted poor countries (HIPC)High incomeHondurasHong Kong SAR, ChinaHungaryIBRD onlyIcelandIDA & IBRD totalIDA blendIDA onlyIDA totalIndiaIndonesiaIran, Islamic Rep.IraqIrelandIsle of ManIsraelItalyJamaicaJapanJordanKazakhstanKenyaKiribatiKorea, Dem. People’s Rep.Korea, Rep.KosovoKuwaitKyrgyz RepublicLao PDRLate-demographic dividendLatin America & Caribbean Latin America & Caribbean (excluding high income)Latin America & the Caribbean (IDA & IBRD countries)LatviaLeast developed countries: UN classificationLebanonLesothoLiberiaLibyaLiechtensteinLithuaniaLow & middle incomeLow incomeLower middle incomeLuxembourgMacedonia, FYRMadagascarMalawiMalaysiaMaldivesMaliMaltaMarshall IslandsMauritaniaMauritiusMexicoMicronesia, Fed. Sts.Middle East & North AfricaMiddle East & North Africa (excluding high income)Middle East & North Africa (IDA & IBRD countries)Middle incomeMoldovaMongoliaMontenegroMoroccoMozambiqueMyanmarNamibiaNepalNetherlandsNew CaledoniaNew ZealandNicaraguaNigerNigeriaNorth AmericaNorthern Mariana IslandsNorwayOECD membersOmanOther small statesPacific island small statesPakistanPalauPanamaPapua New GuineaParaguayPeruPhilippinesPolandPortugalPost-demographic dividendPre-demographic dividendPuerto RicoQatarRomaniaRussian FederationRwandaSamoaSan MarinoSao Tome and PrincipeSaudi ArabiaSenegalSerbiaSeychellesSierra LeoneSingaporeSlovak RepublicSloveniaSmall statesSolomon IslandsSomaliaSouth AfricaSouth AsiaSouth Asia (IDA & IBRD)SpainSri LankaSt. Kitts and NevisSt. LuciaSt. Vincent and the GrenadinesSub-Saharan Africa Sub-Saharan Africa (excluding high income)Sub-Saharan Africa (IDA & IBRD countries)SudanSurinameSwazilandSwedenSwitzerlandSyrian Arab RepublicTajikistanTanzaniaThailandTimor-LesteTogoTongaTrinidad and TobagoTunisiaTurkeyTurkmenistanTurks and Caicos IslandsUgandaUkraineUnited Arab EmiratesUnited KingdomUnited StatesUpper middle incomeUruguayUzbekistanVanuatuVenezuela, RBVietnamVirgin Islands (U.S.)West Bank and GazaWorldYemen, Rep.ZambiaZimbabwe Linha do tempo:
Nesta escala de tempo está apresentado um gráfico de 1962 ano até 2015 ano Syrian Arab Republic. Dados de 1961 ano ausente. O número de observações reais por data: 54.
Fonte (nome):
Indicadores de desenvolvimento mundial
Fonte (organização):
Food and Agriculture Organization, electronic files and web site.
Categorias:
Agriculture & Rural Development, Climate Change, Environment
Foi atualizado:
23 abr 2017 ano
Indicadores de alterações dos valores ao longo dos anos
Mínimo:
24.714
1 jan 2001 ano
Máximo:
34.879
1 jan 1965 ano
Na data de observação
Valor
Mudança absoluta
A alteração em relação ao valor anterior
1 jan 1962 ano
33.442
+33.442
0.0%
1 jan 1963 ano
33.736
+0.294
0.88%
1 jan 1964 ano
34.28
+0.544
1.61%
1 jan 1965 ano
34.879
+0.599
1.75%
1 jan 1966 ano
34.509
-0.37
-1.06%
1 jan 1967 ano
31.957
-2.552
-7.4%
1 jan 1968 ano
31.973
+0.016
0.05%
1 jan 1969 ano
30.346
-1.627
-5.09%
1 jan 1970 ano
30.607
+0.261
0.86%
1 jan 1971 ano
30.749
+0.141
0.46%
1 jan 1972 ano
30.727
-0.022
-0.07%
1 jan 1973 ano
31.075
+0.348
1.13%
1 jan 1974 ano
30.199
-0.876
-2.82%
1 jan 1975 ano
30.917
+0.718
2.38%
1 jan 1976 ano
27.887
-3.031
-9.8%
1 jan 1977 ano
28.621
+0.735
2.63%
1 jan 1978 ano
27.658
-0.963
-3.37%
1 jan 1979 ano
28.017
+0.359
1.3%
1 jan 1980 ano
28.458
+0.441
1.57%
1 jan 1981 ano
28.458
0.0
0.0%
1 jan 1982 ano
28.703
+0.245
0.86%
1 jan 1983 ano
28.774
+0.071
0.25%
1 jan 1984 ano
27.653
-1.121
-3.9%
1 jan 1985 ano
27.772
+0.12
0.43%
1 jan 1986 ano
27.413
-0.359
-1.29%
1 jan 1987 ano
27.277
-0.136
-0.5%
1 jan 1988 ano
27.098
-0.18
-0.66%
1 jan 1989 ano
26.183
-0.914
-3.37%
1 jan 1990 ano
26.107
-0.076
-0.29%
1 jan 1991 ano
26.581
+0.473
1.81%
1 jan 1992 ano
26.14
-0.441
-1.66%
1 jan 1993 ano
25.933
-0.207
-0.79%
1 jan 1994 ano
25.96
+0.027
0.1%
1 jan 1995 ano
26.183
+0.223
0.86%
1 jan 1996 ano
26.113
-0.071
-0.27%
1 jan 1997 ano
25.786
-0.326
-1.25%
1 jan 1998 ano
25.96
+0.174
0.68%
1 jan 1999 ano
25.623
-0.337
-1.3%
1 jan 2000 ano
25.579
-0.044
-0.17%
1 jan 2001 ano
24.714
-0.865
-3.38%
1 jan 2002 ano
25.22
+0.506
2.05%
1 jan 2003 ano
24.992
-0.229
-0.91%
1 jan 2004 ano
25.192
+0.2
0.8%
1 jan 2005 ano
25.914
+0.722
2.87%
1 jan 2006 ano
25.467
-0.447
-1.72%
1 jan 2007 ano
25.432
-0.036
-0.14%
1 jan 2008 ano
25.79
+0.358
1.41%
1 jan 2009 ano
25.588
-0.201
-0.78%
1 jan 2010 ano
25.43
-0.158
-0.62%
1 jan 2011 ano
25.524
+0.094
0.37%
1 jan 2012 ano
25.388
-0.136
-0.53%
1 jan 2013 ano
25.404
+0.016
0.06%
1 jan 2014 ano
25.388
-0.016
-0.06%
1 jan 2015 ano
25.388
0.0
0.0%
Classificação de países por estatísticas atuais por anos


Comentários: