29
/pt/
pt
AIzaSyAYiBZKx7MnpbEhh9jyipgxe19OcubqV5w
April 1, 2024
238958
Sierra Leone
SLE
true
2
1
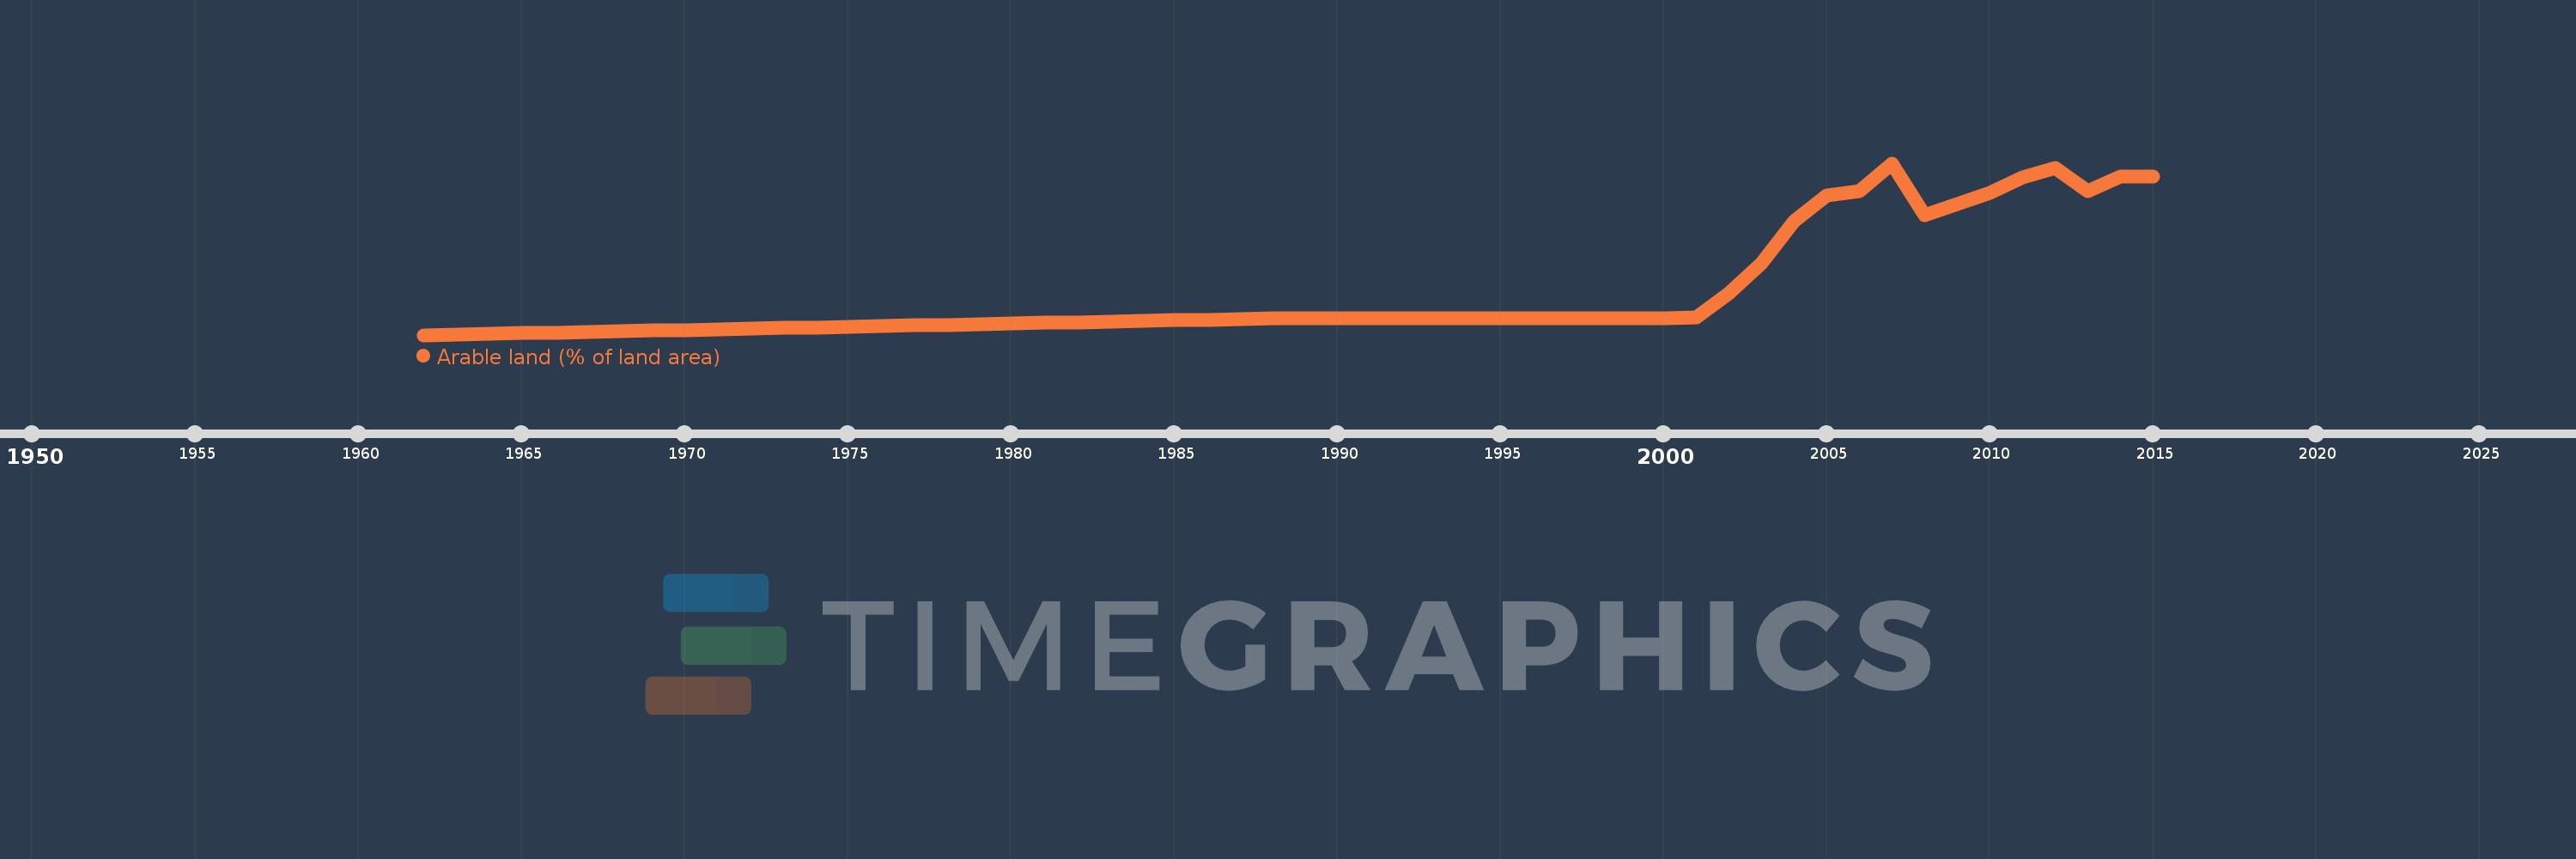
Arable land (% of land area)
2015,2014,2013,2012,2011,2010,2009,2008,2007,2006,2005,2004,2003,2002,2001,2000,1999,1998,1997,1996,1995,1994,1993,1992,1991,1990,1989,1988,1987,1986,1985,1984,1983,1982,1981,1980,1979,1978,1977,1976,1975,1974,1973,1972,1971,1970,1969,1968,1967,1966,1965,1964,1963,1962
Estas estatísticas em outros países:
AfghanistanAlbaniaAlgeriaAmerican SamoaAndorraAngolaAntigua and BarbudaArab WorldArgentinaArmeniaArubaAustraliaAustriaAzerbaijanBahamas, TheBahrainBangladeshBarbadosBelarusBelgiumBelizeBeninBermudaBhutanBoliviaBosnia and HerzegovinaBotswanaBrazilBritish Virgin IslandsBrunei DarussalamBulgariaBurkina FasoBurundiCabo VerdeCambodiaCameroonCanadaCaribbean small statesCayman IslandsCentral African RepublicCentral Europe and the BalticsChadChannel IslandsChileChinaColombiaComorosCongo, Dem. Rep.Congo, Rep.Costa RicaCote d'IvoireCroatiaCubaCyprusCzech RepublicDenmarkDjiboutiDominicaDominican RepublicEarly-demographic dividendEast Asia & PacificEast Asia & Pacific (excluding high income)East Asia & Pacific (IDA & IBRD countries)EcuadorEgypt, Arab Rep.El SalvadorEquatorial GuineaEritreaEstoniaEthiopiaEuro areaEurope & Central AsiaEurope & Central Asia (excluding high income)Europe & Central Asia (IDA & IBRD countries)European UnionFaroe IslandsFijiFinlandFragile and conflict affected situationsFranceFrench PolynesiaGabonGambia, TheGeorgiaGermanyGhanaGreeceGreenlandGrenadaGuamGuatemalaGuineaGuinea-BissauGuyanaHaitiHeavily indebted poor countries (HIPC)High incomeHondurasHong Kong SAR, ChinaHungaryIBRD onlyIcelandIDA & IBRD totalIDA blendIDA onlyIDA totalIndiaIndonesiaIran, Islamic Rep.IraqIrelandIsle of ManIsraelItalyJamaicaJapanJordanKazakhstanKenyaKiribatiKorea, Dem. People’s Rep.Korea, Rep.KosovoKuwaitKyrgyz RepublicLao PDRLate-demographic dividendLatin America & Caribbean Latin America & Caribbean (excluding high income)Latin America & the Caribbean (IDA & IBRD countries)LatviaLeast developed countries: UN classificationLebanonLesothoLiberiaLibyaLiechtensteinLithuaniaLow & middle incomeLow incomeLower middle incomeLuxembourgMacedonia, FYRMadagascarMalawiMalaysiaMaldivesMaliMaltaMarshall IslandsMauritaniaMauritiusMexicoMicronesia, Fed. Sts.Middle East & North AfricaMiddle East & North Africa (excluding high income)Middle East & North Africa (IDA & IBRD countries)Middle incomeMoldovaMongoliaMontenegroMoroccoMozambiqueMyanmarNamibiaNepalNetherlandsNew CaledoniaNew ZealandNicaraguaNigerNigeriaNorth AmericaNorthern Mariana IslandsNorwayOECD membersOmanOther small statesPacific island small statesPakistanPalauPanamaPapua New GuineaParaguayPeruPhilippinesPolandPortugalPost-demographic dividendPre-demographic dividendPuerto RicoQatarRomaniaRussian FederationRwandaSamoaSan MarinoSao Tome and PrincipeSaudi ArabiaSenegalSerbiaSeychellesSierra LeoneSingaporeSlovak RepublicSloveniaSmall statesSolomon IslandsSomaliaSouth AfricaSouth AsiaSouth Asia (IDA & IBRD)SpainSri LankaSt. Kitts and NevisSt. LuciaSt. Vincent and the GrenadinesSub-Saharan Africa Sub-Saharan Africa (excluding high income)Sub-Saharan Africa (IDA & IBRD countries)SudanSurinameSwazilandSwedenSwitzerlandSyrian Arab RepublicTajikistanTanzaniaThailandTimor-LesteTogoTongaTrinidad and TobagoTunisiaTurkeyTurkmenistanTurks and Caicos IslandsUgandaUkraineUnited Arab EmiratesUnited KingdomUnited StatesUpper middle incomeUruguayUzbekistanVanuatuVenezuela, RBVietnamVirgin Islands (U.S.)West Bank and GazaWorldYemen, Rep.ZambiaZimbabwe Linha do tempo:
Nesta escala de tempo está apresentado um gráfico de 1962 ano até 2015 ano Sierra Leone. Dados de 1961 ano ausente. O número de observações reais por data: 54.
Fonte (nome):
Indicadores de desenvolvimento mundial
Fonte (organização):
Food and Agriculture Organization, electronic files and web site.
Categorias:
Agriculture & Rural Development, Climate Change, Environment
Foi atualizado:
23 abr 2017 ano
Indicadores de alterações dos valores ao longo dos anos
Mínimo:
4.918
1 jan 1962 ano
Máximo:
23.412
1 jan 2007 ano
Na data de observação
Valor
Mudança absoluta
A alteração em relação ao valor anterior
1 jan 1962 ano
4.918
+4.918
0.0%
1 jan 1963 ano
4.988
+0.069
1.41%
1 jan 1964 ano
5.057
+0.069
1.39%
1 jan 1965 ano
5.126
+0.069
1.37%
1 jan 1966 ano
5.195
+0.069
1.35%
1 jan 1967 ano
5.265
+0.069
1.33%
1 jan 1968 ano
5.334
+0.069
1.32%
1 jan 1969 ano
5.403
+0.069
1.3%
1 jan 1970 ano
5.472
+0.069
1.28%
1 jan 1971 ano
5.542
+0.069
1.27%
1 jan 1972 ano
5.611
+0.069
1.25%
1 jan 1973 ano
5.68
+0.069
1.23%
1 jan 1974 ano
5.75
+0.069
1.22%
1 jan 1975 ano
5.819
+0.069
1.2%
1 jan 1976 ano
5.888
+0.069
1.19%
1 jan 1977 ano
5.957
+0.069
1.18%
1 jan 1978 ano
6.027
+0.069
1.16%
1 jan 1979 ano
6.096
+0.069
1.15%
1 jan 1980 ano
6.165
+0.069
1.14%
1 jan 1981 ano
6.234
+0.069
1.12%
1 jan 1982 ano
6.304
+0.069
1.11%
1 jan 1983 ano
6.373
+0.069
1.1%
1 jan 1984 ano
6.442
+0.069
1.09%
1 jan 1985 ano
6.511
+0.069
1.08%
1 jan 1986 ano
6.581
+0.069
1.06%
1 jan 1987 ano
6.65
+0.069
1.05%
1 jan 1988 ano
6.719
+0.069
1.04%
1 jan 1989 ano
6.733
+0.014
0.21%
1 jan 1990 ano
6.733
0.0
0.0%
1 jan 1991 ano
6.733
0.0
0.0%
1 jan 1992 ano
6.733
0.0
0.0%
1 jan 1993 ano
6.733
0.0
0.0%
1 jan 1994 ano
6.733
0.0
0.0%
1 jan 1995 ano
6.719
-0.014
-0.21%
1 jan 1996 ano
6.719
0.0
0.0%
1 jan 1997 ano
6.719
0.0
0.0%
1 jan 1998 ano
6.705
-0.014
-0.21%
1 jan 1999 ano
6.705
0.0
0.0%
1 jan 2000 ano
6.705
0.0
0.0%
1 jan 2001 ano
6.789
+0.083
1.24%
1 jan 2002 ano
9.442
+2.653
39.09%
1 jan 2003 ano
12.608
+3.167
33.54%
1 jan 2004 ano
17.133
+4.525
35.89%
1 jan 2005 ano
19.919
+2.786
16.26%
1 jan 2006 ano
20.394
+0.475
2.39%
1 jan 2007 ano
23.412
+3.018
14.8%
1 jan 2008 ano
17.785
-5.627
-24.03%
1 jan 2009 ano
19.011
+1.226
6.89%
1 jan 2010 ano
20.241
+1.229
6.47%
1 jan 2011 ano
21.895
+1.654
8.17%
1 jan 2012 ano
22.896
+1.001
4.57%
1 jan 2013 ano
20.389
-2.507
-10.95%
1 jan 2014 ano
21.94
+1.552
7.61%
1 jan 2015 ano
21.945
+0.005
0.02%
Classificação de países por estatísticas atuais por anos


Comentários: