29
/pt/
pt
AIzaSyAYiBZKx7MnpbEhh9jyipgxe19OcubqV5w
April 1, 2024
130104
Ethiopia
ETH
true
2
1
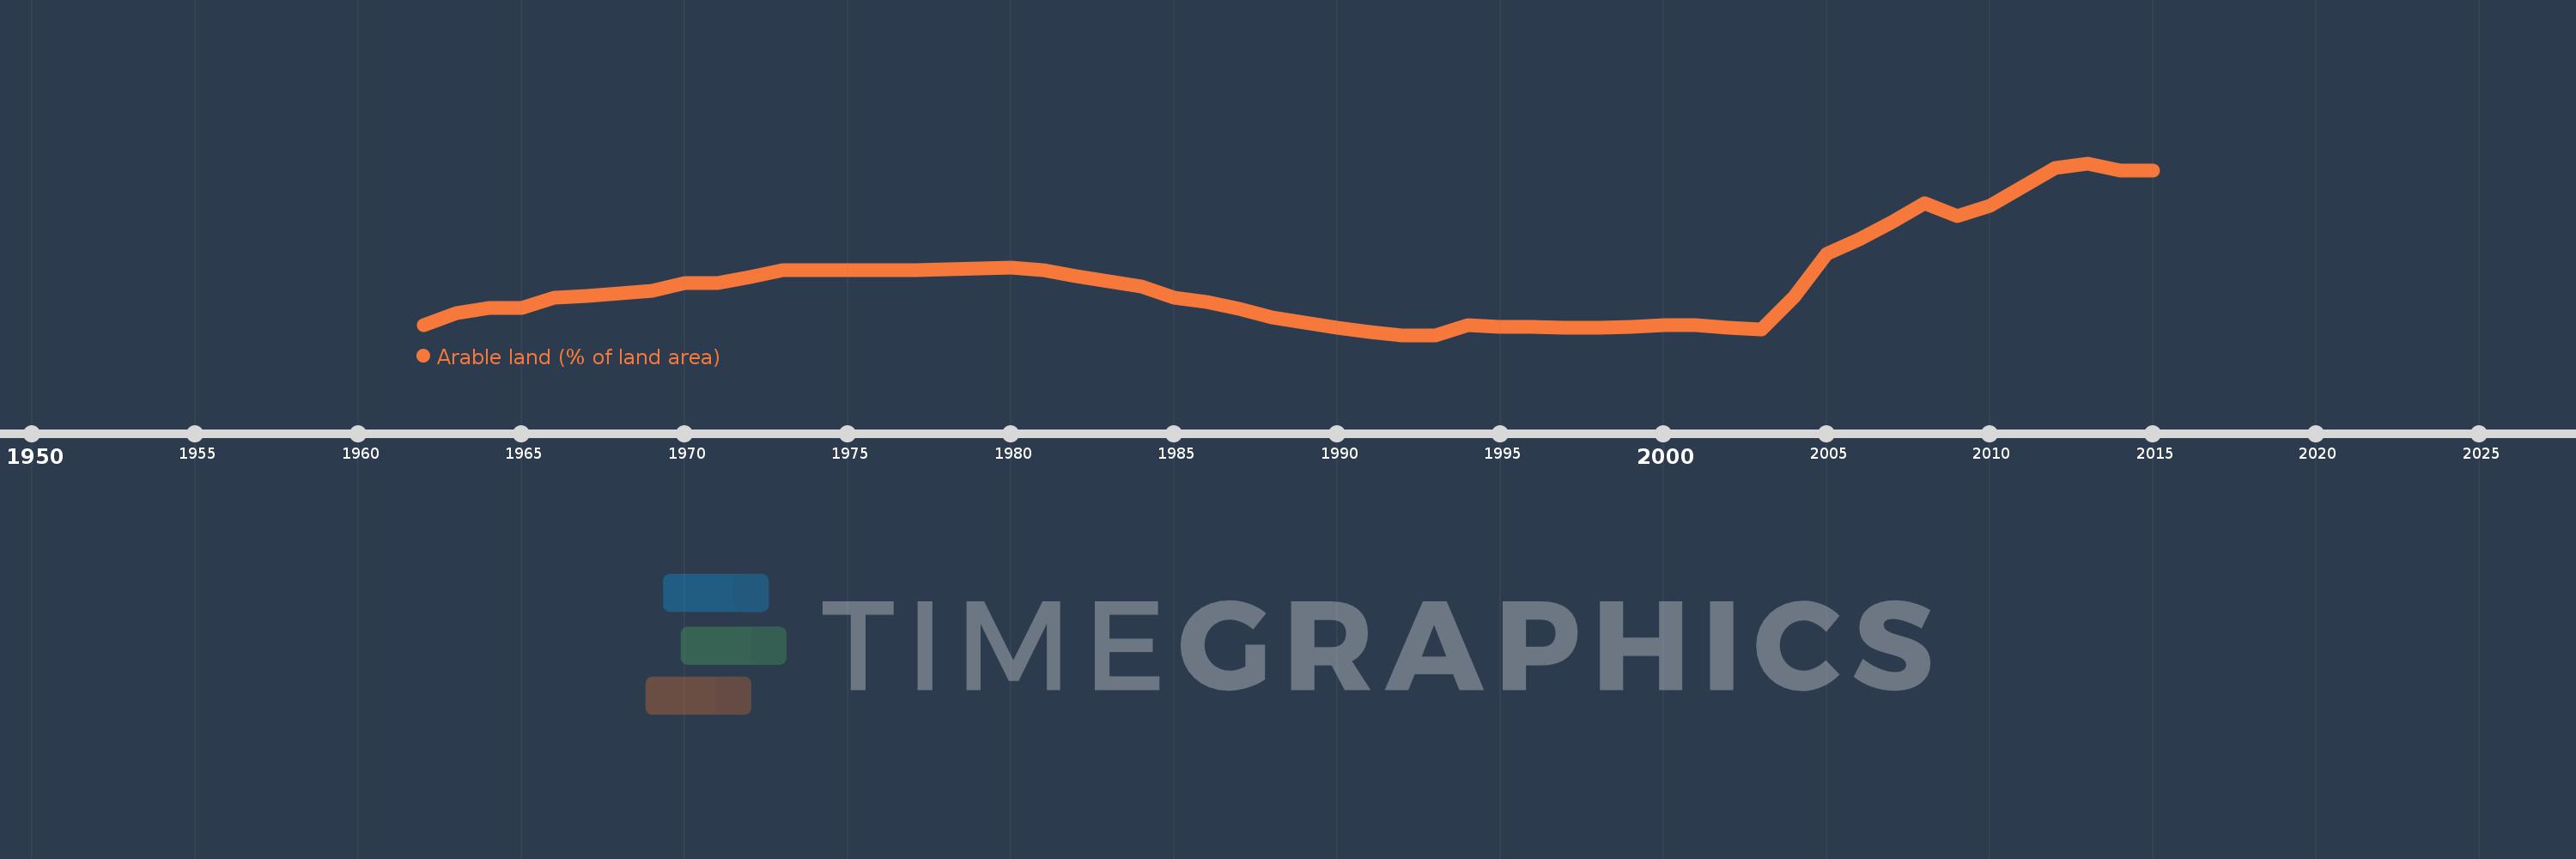
Arable land (% of land area)
2015,2014,2013,2012,2011,2010,2009,2008,2007,2006,2005,2004,2003,2002,2001,2000,1999,1998,1997,1996,1995,1994,1993,1992,1991,1990,1989,1988,1987,1986,1985,1984,1983,1982,1981,1980,1979,1978,1977,1976,1975,1974,1973,1972,1971,1970,1969,1968,1967,1966,1965,1964,1963,1962
Estas estatísticas em outros países:
AfghanistanAlbaniaAlgeriaAmerican SamoaAndorraAngolaAntigua and BarbudaArab WorldArgentinaArmeniaArubaAustraliaAustriaAzerbaijanBahamas, TheBahrainBangladeshBarbadosBelarusBelgiumBelizeBeninBermudaBhutanBoliviaBosnia and HerzegovinaBotswanaBrazilBritish Virgin IslandsBrunei DarussalamBulgariaBurkina FasoBurundiCabo VerdeCambodiaCameroonCanadaCaribbean small statesCayman IslandsCentral African RepublicCentral Europe and the BalticsChadChannel IslandsChileChinaColombiaComorosCongo, Dem. Rep.Congo, Rep.Costa RicaCote d'IvoireCroatiaCubaCyprusCzech RepublicDenmarkDjiboutiDominicaDominican RepublicEarly-demographic dividendEast Asia & PacificEast Asia & Pacific (excluding high income)East Asia & Pacific (IDA & IBRD countries)EcuadorEgypt, Arab Rep.El SalvadorEquatorial GuineaEritreaEstoniaEthiopiaEuro areaEurope & Central AsiaEurope & Central Asia (excluding high income)Europe & Central Asia (IDA & IBRD countries)European UnionFaroe IslandsFijiFinlandFragile and conflict affected situationsFranceFrench PolynesiaGabonGambia, TheGeorgiaGermanyGhanaGreeceGreenlandGrenadaGuamGuatemalaGuineaGuinea-BissauGuyanaHaitiHeavily indebted poor countries (HIPC)High incomeHondurasHong Kong SAR, ChinaHungaryIBRD onlyIcelandIDA & IBRD totalIDA blendIDA onlyIDA totalIndiaIndonesiaIran, Islamic Rep.IraqIrelandIsle of ManIsraelItalyJamaicaJapanJordanKazakhstanKenyaKiribatiKorea, Dem. People’s Rep.Korea, Rep.KosovoKuwaitKyrgyz RepublicLao PDRLate-demographic dividendLatin America & Caribbean Latin America & Caribbean (excluding high income)Latin America & the Caribbean (IDA & IBRD countries)LatviaLeast developed countries: UN classificationLebanonLesothoLiberiaLibyaLiechtensteinLithuaniaLow & middle incomeLow incomeLower middle incomeLuxembourgMacedonia, FYRMadagascarMalawiMalaysiaMaldivesMaliMaltaMarshall IslandsMauritaniaMauritiusMexicoMicronesia, Fed. Sts.Middle East & North AfricaMiddle East & North Africa (excluding high income)Middle East & North Africa (IDA & IBRD countries)Middle incomeMoldovaMongoliaMontenegroMoroccoMozambiqueMyanmarNamibiaNepalNetherlandsNew CaledoniaNew ZealandNicaraguaNigerNigeriaNorth AmericaNorthern Mariana IslandsNorwayOECD membersOmanOther small statesPacific island small statesPakistanPalauPanamaPapua New GuineaParaguayPeruPhilippinesPolandPortugalPost-demographic dividendPre-demographic dividendPuerto RicoQatarRomaniaRussian FederationRwandaSamoaSan MarinoSao Tome and PrincipeSaudi ArabiaSenegalSerbiaSeychellesSierra LeoneSingaporeSlovak RepublicSloveniaSmall statesSolomon IslandsSomaliaSouth AfricaSouth AsiaSouth Asia (IDA & IBRD)SpainSri LankaSt. Kitts and NevisSt. LuciaSt. Vincent and the GrenadinesSub-Saharan Africa Sub-Saharan Africa (excluding high income)Sub-Saharan Africa (IDA & IBRD countries)SudanSurinameSwazilandSwedenSwitzerlandSyrian Arab RepublicTajikistanTanzaniaThailandTimor-LesteTogoTongaTrinidad and TobagoTunisiaTurkeyTurkmenistanTurks and Caicos IslandsUgandaUkraineUnited Arab EmiratesUnited KingdomUnited StatesUpper middle incomeUruguayUzbekistanVanuatuVenezuela, RBVietnamVirgin Islands (U.S.)West Bank and GazaWorldYemen, Rep.ZambiaZimbabwe Linha do tempo:
Nesta escala de tempo está apresentado um gráfico de 1962 ano até 2015 ano Ethiopia. Dados de 1961 ano ausente. O número de observações reais por data: 54.
Fonte (nome):
Indicadores de desenvolvimento mundial
Fonte (organização):
Food and Agriculture Organization, electronic files and web site.
Categorias:
Agriculture & Rural Development, Climate Change, Environment
Foi atualizado:
23 abr 2017 ano
Indicadores de alterações dos valores ao longo dos anos
Mínimo:
9.673
1 jan 1992 ano
Máximo:
15.346
1 jan 2013 ano
Na data de observação
Valor
Mudança absoluta
A alteração em relação ao valor anterior
1 jan 1962 ano
9.991
+9.991
0.0%
1 jan 1963 ano
10.408
+0.417
4.17%
1 jan 1964 ano
10.564
+0.156
1.5%
1 jan 1965 ano
10.564
0.0
0.0%
1 jan 1966 ano
10.895
+0.331
3.13%
1 jan 1967 ano
10.963
+0.068
0.63%
1 jan 1968 ano
11.035
+0.073
0.66%
1 jan 1969 ano
11.126
+0.091
0.82%
1 jan 1970 ano
11.381
+0.254
2.29%
1 jan 1971 ano
11.381
0.0
0.0%
1 jan 1972 ano
11.599
+0.218
1.92%
1 jan 1973 ano
11.807
+0.209
1.8%
1 jan 1974 ano
11.807
0.0
0.0%
1 jan 1975 ano
11.807
0.0
0.0%
1 jan 1976 ano
11.807
0.0
0.0%
1 jan 1977 ano
11.807
0.0
0.0%
1 jan 1978 ano
11.835
+0.027
0.23%
1 jan 1979 ano
11.862
+0.027
0.23%
1 jan 1980 ano
11.903
+0.041
0.34%
1 jan 1981 ano
11.807
-0.095
-0.8%
1 jan 1982 ano
11.626
-0.182
-1.54%
1 jan 1983 ano
11.444
-0.182
-1.56%
1 jan 1984 ano
11.262
-0.182
-1.59%
1 jan 1985 ano
10.899
-0.363
-3.23%
1 jan 1986 ano
10.763
-0.136
-1.25%
1 jan 1987 ano
10.536
-0.227
-2.11%
1 jan 1988 ano
10.263
-0.272
-2.59%
1 jan 1989 ano
10.082
-0.182
-1.77%
1 jan 1990 ano
9.9
-0.182
-1.8%
1 jan 1991 ano
9.764
-0.136
-1.38%
1 jan 1992 ano
9.673
-0.091
-0.93%
1 jan 1993 ano
9.673
0.0
0.0%
1 jan 1994 ano
10.0
+0.327
3.38%
1 jan 1995 ano
9.932
-0.068
-0.68%
1 jan 1996 ano
9.94
+0.008
0.08%
1 jan 1997 ano
9.927
-0.013
-0.13%
1 jan 1998 ano
9.9
-0.027
-0.27%
1 jan 1999 ano
9.95
+0.05
0.51%
1 jan 2000 ano
10.0
+0.05
0.5%
1 jan 2001 ano
10.0
0.0
0.0%
1 jan 2002 ano
9.908
-0.092
-0.92%
1 jan 2003 ano
9.853
-0.055
-0.56%
1 jan 2004 ano
10.928
+1.075
10.91%
1 jan 2005 ano
12.364
+1.436
13.14%
1 jan 2006 ano
12.823
+0.459
3.71%
1 jan 2007 ano
13.396
+0.573
4.47%
1 jan 2008 ano
14.038
+0.642
4.79%
1 jan 2009 ano
13.606
-0.432
-3.08%
1 jan 2010 ano
13.948
+0.342
2.51%
1 jan 2011 ano
14.565
+0.617
4.42%
1 jan 2012 ano
15.193
+0.628
4.31%
1 jan 2013 ano
15.346
+0.153
1.01%
1 jan 2014 ano
15.119
-0.227
-1.48%
1 jan 2015 ano
15.119
0.0
0.0%
Classificação de países por estatísticas atuais por anos


Comentários: