29
/pt/
pt
AIzaSyAYiBZKx7MnpbEhh9jyipgxe19OcubqV5w
April 1, 2024
132903
Finland
FIN
true
2
1
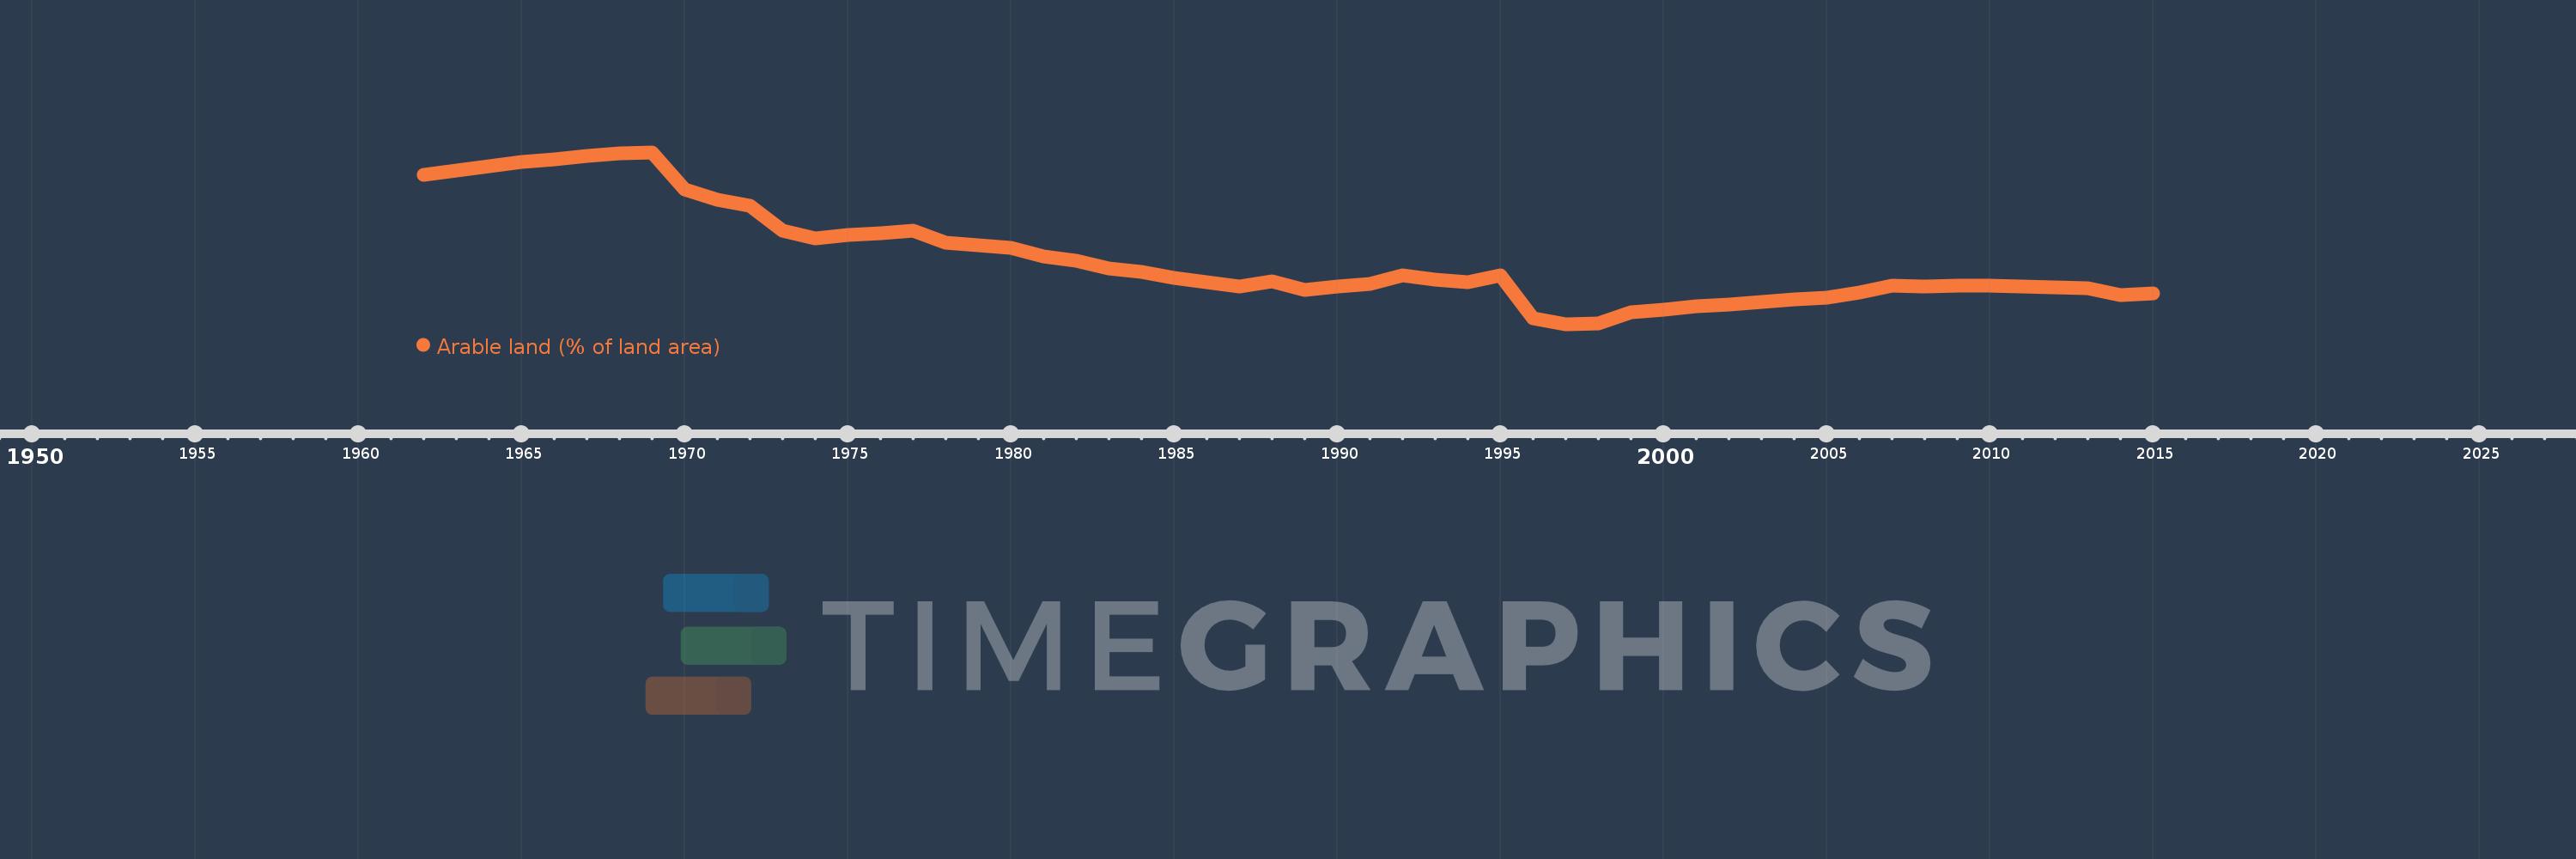
Arable land (% of land area)
2015,2014,2013,2012,2011,2010,2009,2008,2007,2006,2005,2004,2003,2002,2001,2000,1999,1998,1997,1996,1995,1994,1993,1992,1991,1990,1989,1988,1987,1986,1985,1984,1983,1982,1981,1980,1979,1978,1977,1976,1975,1974,1973,1972,1971,1970,1969,1968,1967,1966,1965,1964,1963,1962
Estas estatísticas em outros países:
AfghanistanAlbaniaAlgeriaAmerican SamoaAndorraAngolaAntigua and BarbudaArab WorldArgentinaArmeniaArubaAustraliaAustriaAzerbaijanBahamas, TheBahrainBangladeshBarbadosBelarusBelgiumBelizeBeninBermudaBhutanBoliviaBosnia and HerzegovinaBotswanaBrazilBritish Virgin IslandsBrunei DarussalamBulgariaBurkina FasoBurundiCabo VerdeCambodiaCameroonCanadaCaribbean small statesCayman IslandsCentral African RepublicCentral Europe and the BalticsChadChannel IslandsChileChinaColombiaComorosCongo, Dem. Rep.Congo, Rep.Costa RicaCote d'IvoireCroatiaCubaCyprusCzech RepublicDenmarkDjiboutiDominicaDominican RepublicEarly-demographic dividendEast Asia & PacificEast Asia & Pacific (excluding high income)East Asia & Pacific (IDA & IBRD countries)EcuadorEgypt, Arab Rep.El SalvadorEquatorial GuineaEritreaEstoniaEthiopiaEuro areaEurope & Central AsiaEurope & Central Asia (excluding high income)Europe & Central Asia (IDA & IBRD countries)European UnionFaroe IslandsFijiFinlandFragile and conflict affected situationsFranceFrench PolynesiaGabonGambia, TheGeorgiaGermanyGhanaGreeceGreenlandGrenadaGuamGuatemalaGuineaGuinea-BissauGuyanaHaitiHeavily indebted poor countries (HIPC)High incomeHondurasHong Kong SAR, ChinaHungaryIBRD onlyIcelandIDA & IBRD totalIDA blendIDA onlyIDA totalIndiaIndonesiaIran, Islamic Rep.IraqIrelandIsle of ManIsraelItalyJamaicaJapanJordanKazakhstanKenyaKiribatiKorea, Dem. People’s Rep.Korea, Rep.KosovoKuwaitKyrgyz RepublicLao PDRLate-demographic dividendLatin America & Caribbean Latin America & Caribbean (excluding high income)Latin America & the Caribbean (IDA & IBRD countries)LatviaLeast developed countries: UN classificationLebanonLesothoLiberiaLibyaLiechtensteinLithuaniaLow & middle incomeLow incomeLower middle incomeLuxembourgMacedonia, FYRMadagascarMalawiMalaysiaMaldivesMaliMaltaMarshall IslandsMauritaniaMauritiusMexicoMicronesia, Fed. Sts.Middle East & North AfricaMiddle East & North Africa (excluding high income)Middle East & North Africa (IDA & IBRD countries)Middle incomeMoldovaMongoliaMontenegroMoroccoMozambiqueMyanmarNamibiaNepalNetherlandsNew CaledoniaNew ZealandNicaraguaNigerNigeriaNorth AmericaNorthern Mariana IslandsNorwayOECD membersOmanOther small statesPacific island small statesPakistanPalauPanamaPapua New GuineaParaguayPeruPhilippinesPolandPortugalPost-demographic dividendPre-demographic dividendPuerto RicoQatarRomaniaRussian FederationRwandaSamoaSan MarinoSao Tome and PrincipeSaudi ArabiaSenegalSerbiaSeychellesSierra LeoneSingaporeSlovak RepublicSloveniaSmall statesSolomon IslandsSomaliaSouth AfricaSouth AsiaSouth Asia (IDA & IBRD)SpainSri LankaSt. Kitts and NevisSt. LuciaSt. Vincent and the GrenadinesSub-Saharan Africa Sub-Saharan Africa (excluding high income)Sub-Saharan Africa (IDA & IBRD countries)SudanSurinameSwazilandSwedenSwitzerlandSyrian Arab RepublicTajikistanTanzaniaThailandTimor-LesteTogoTongaTrinidad and TobagoTunisiaTurkeyTurkmenistanTurks and Caicos IslandsUgandaUkraineUnited Arab EmiratesUnited KingdomUnited StatesUpper middle incomeUruguayUzbekistanVanuatuVenezuela, RBVietnamVirgin Islands (U.S.)West Bank and GazaWorldYemen, Rep.ZambiaZimbabwe Linha do tempo:
Nesta escala de tempo está apresentado um gráfico de 1962 ano até 2015 ano Finland. Dados de 1961 ano ausente. O número de observações reais por data: 54.
Fonte (nome):
Indicadores de desenvolvimento mundial
Fonte (organização):
Food and Agriculture Organization, electronic files and web site.
Categorias:
Agriculture & Rural Development, Climate Change, Environment
Foi atualizado:
23 abr 2017 ano
Indicadores de alterações dos valores ao longo dos anos
Mínimo:
6.971
1 jan 1997 ano
Máximo:
9.012
1 jan 1969 ano
Na data de observação
Valor
Mudança absoluta
A alteração em relação ao valor anterior
1 jan 1962 ano
8.748
+8.748
0.0%
1 jan 1963 ano
8.796
+0.047
0.54%
1 jan 1964 ano
8.85
+0.054
0.61%
1 jan 1965 ano
8.896
+0.046
0.52%
1 jan 1966 ano
8.932
+0.036
0.4%
1 jan 1967 ano
8.974
+0.042
0.47%
1 jan 1968 ano
9.004
+0.03
0.33%
1 jan 1969 ano
9.012
+0.009
0.1%
1 jan 1970 ano
8.574
-0.439
-4.87%
1 jan 1971 ano
8.448
-0.126
-1.47%
1 jan 1972 ano
8.381
-0.067
-0.8%
1 jan 1973 ano
8.085
-0.295
-3.53%
1 jan 1974 ano
7.988
-0.097
-1.2%
1 jan 1975 ano
8.028
+0.04
0.51%
1 jan 1976 ano
8.05
+0.021
0.26%
1 jan 1977 ano
8.083
+0.033
0.41%
1 jan 1978 ano
7.941
-0.142
-1.76%
1 jan 1979 ano
7.913
-0.028
-0.35%
1 jan 1980 ano
7.878
-0.035
-0.44%
1 jan 1981 ano
7.778
-0.1
-1.27%
1 jan 1982 ano
7.724
-0.054
-0.69%
1 jan 1983 ano
7.632
-0.092
-1.19%
1 jan 1984 ano
7.589
-0.044
-0.57%
1 jan 1985 ano
7.517
-0.071
-0.94%
1 jan 1986 ano
7.468
-0.049
-0.65%
1 jan 1987 ano
7.418
-0.05
-0.67%
1 jan 1988 ano
7.483
+0.064
0.87%
1 jan 1989 ano
7.375
-0.108
-1.44%
1 jan 1990 ano
7.422
+0.047
0.64%
1 jan 1991 ano
7.449
+0.027
0.36%
1 jan 1992 ano
7.55
+0.101
1.36%
1 jan 1993 ano
7.5
-0.05
-0.67%
1 jan 1994 ano
7.471
-0.029
-0.39%
1 jan 1995 ano
7.55
+0.079
1.06%
1 jan 1996 ano
7.037
-0.513
-6.79%
1 jan 1997 ano
6.971
-0.066
-0.94%
1 jan 1998 ano
6.979
+0.007
0.1%
1 jan 1999 ano
7.115
+0.137
1.96%
1 jan 2000 ano
7.148
+0.033
0.46%
1 jan 2001 ano
7.184
+0.036
0.51%
1 jan 2002 ano
7.201
+0.017
0.24%
1 jan 2003 ano
7.24
+0.039
0.54%
1 jan 2004 ano
7.268
+0.029
0.39%
1 jan 2005 ano
7.291
+0.023
0.31%
1 jan 2006 ano
7.343
+0.052
0.71%
1 jan 2007 ano
7.433
+0.091
1.23%
1 jan 2008 ano
7.421
-0.012
-0.16%
1 jan 2009 ano
7.434
+0.013
0.17%
1 jan 2010 ano
7.431
-0.003
-0.04%
1 jan 2011 ano
7.42
-0.012
-0.15%
1 jan 2012 ano
7.406
-0.014
-0.19%
1 jan 2013 ano
7.401
-0.005
-0.06%
1 jan 2014 ano
7.319
-0.082
-1.11%
1 jan 2015 ano
7.341
+0.022
0.3%
Classificação de países por estatísticas atuais por anos


Comentários: