29
/pt/
pt
AIzaSyAYiBZKx7MnpbEhh9jyipgxe19OcubqV5w
April 1, 2024
115596
Cuba
CUB
true
2
1
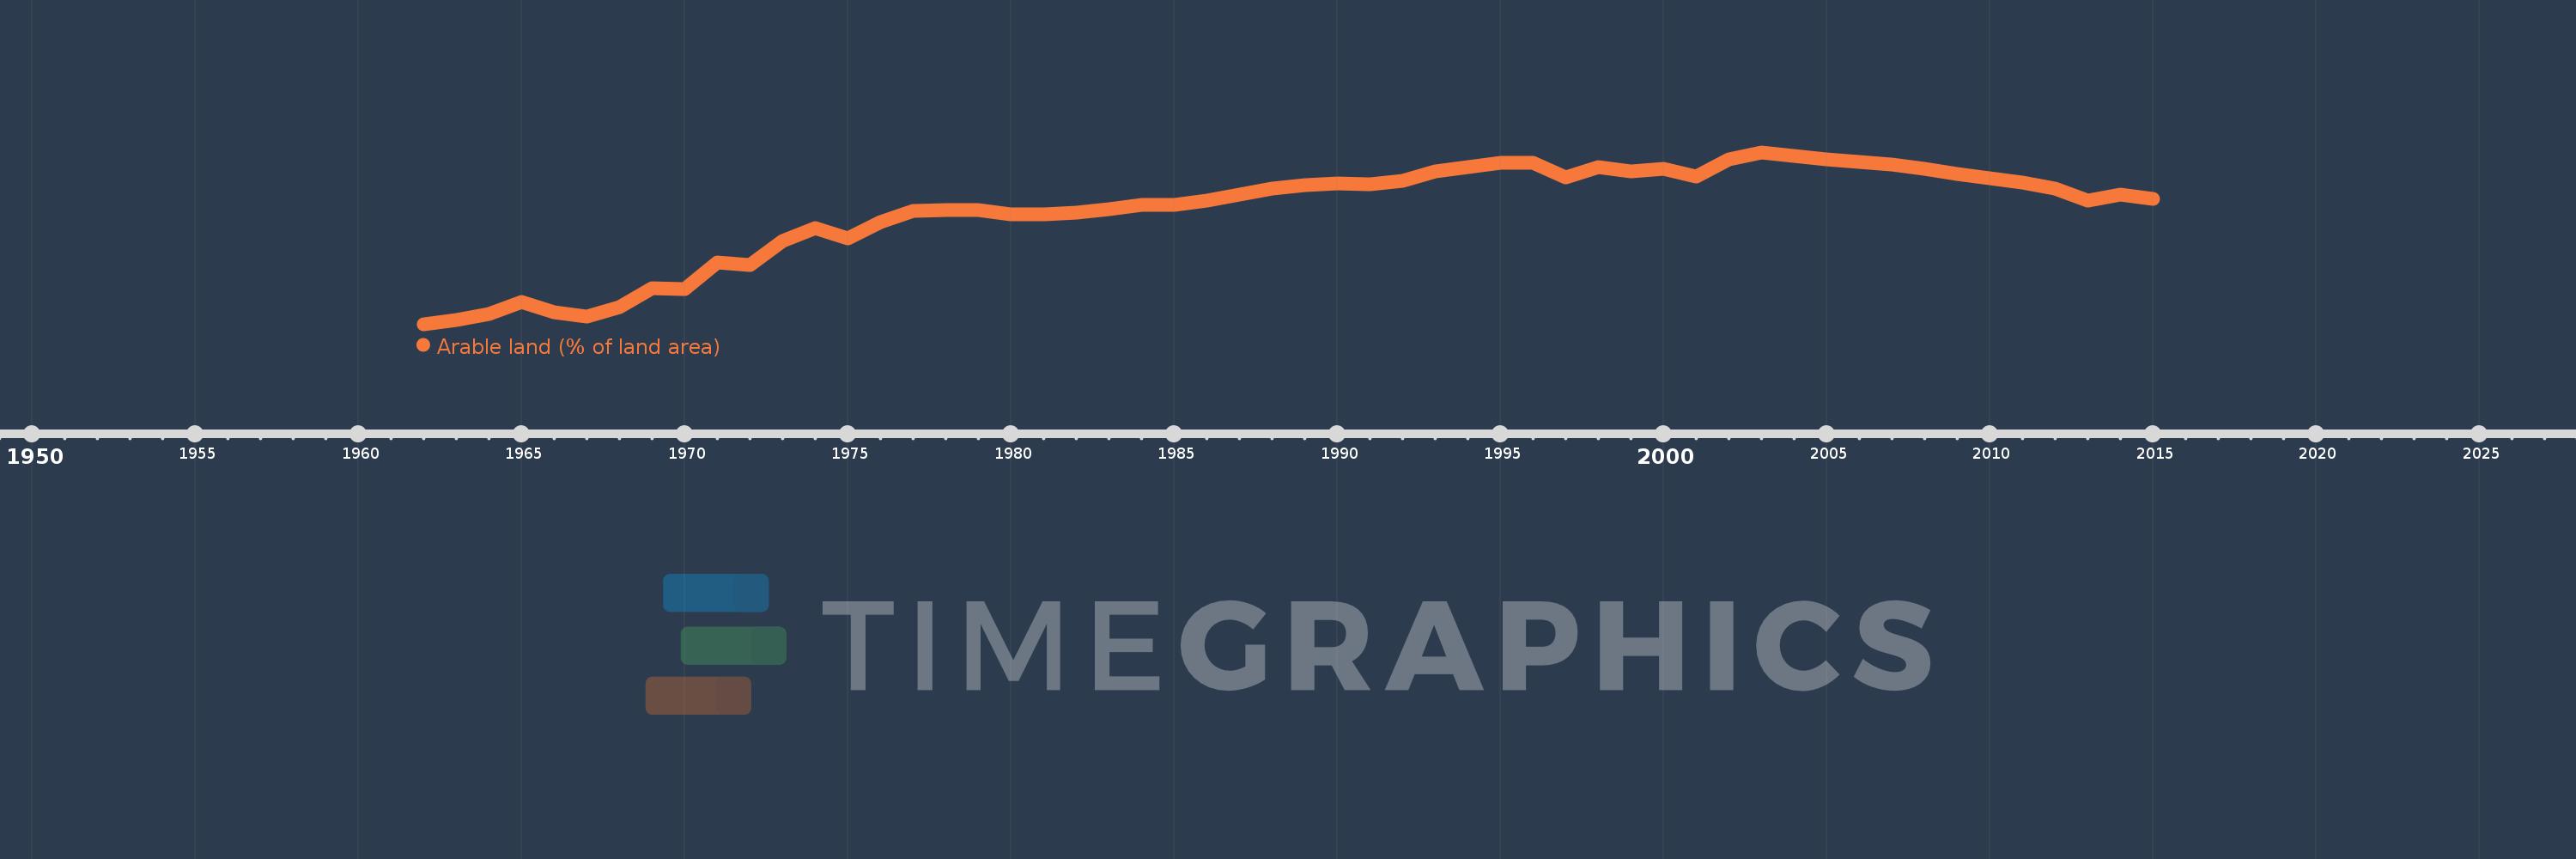
Arable land (% of land area)
2015,2014,2013,2012,2011,2010,2009,2008,2007,2006,2005,2004,2003,2002,2001,2000,1999,1998,1997,1996,1995,1994,1993,1992,1991,1990,1989,1988,1987,1986,1985,1984,1983,1982,1981,1980,1979,1978,1977,1976,1975,1974,1973,1972,1971,1970,1969,1968,1967,1966,1965,1964,1963,1962
Estas estatísticas em outros países:
AfghanistanAlbaniaAlgeriaAmerican SamoaAndorraAngolaAntigua and BarbudaArab WorldArgentinaArmeniaArubaAustraliaAustriaAzerbaijanBahamas, TheBahrainBangladeshBarbadosBelarusBelgiumBelizeBeninBermudaBhutanBoliviaBosnia and HerzegovinaBotswanaBrazilBritish Virgin IslandsBrunei DarussalamBulgariaBurkina FasoBurundiCabo VerdeCambodiaCameroonCanadaCaribbean small statesCayman IslandsCentral African RepublicCentral Europe and the BalticsChadChannel IslandsChileChinaColombiaComorosCongo, Dem. Rep.Congo, Rep.Costa RicaCote d'IvoireCroatiaCubaCyprusCzech RepublicDenmarkDjiboutiDominicaDominican RepublicEarly-demographic dividendEast Asia & PacificEast Asia & Pacific (excluding high income)East Asia & Pacific (IDA & IBRD countries)EcuadorEgypt, Arab Rep.El SalvadorEquatorial GuineaEritreaEstoniaEthiopiaEuro areaEurope & Central AsiaEurope & Central Asia (excluding high income)Europe & Central Asia (IDA & IBRD countries)European UnionFaroe IslandsFijiFinlandFragile and conflict affected situationsFranceFrench PolynesiaGabonGambia, TheGeorgiaGermanyGhanaGreeceGreenlandGrenadaGuamGuatemalaGuineaGuinea-BissauGuyanaHaitiHeavily indebted poor countries (HIPC)High incomeHondurasHong Kong SAR, ChinaHungaryIBRD onlyIcelandIDA & IBRD totalIDA blendIDA onlyIDA totalIndiaIndonesiaIran, Islamic Rep.IraqIrelandIsle of ManIsraelItalyJamaicaJapanJordanKazakhstanKenyaKiribatiKorea, Dem. People’s Rep.Korea, Rep.KosovoKuwaitKyrgyz RepublicLao PDRLate-demographic dividendLatin America & Caribbean Latin America & Caribbean (excluding high income)Latin America & the Caribbean (IDA & IBRD countries)LatviaLeast developed countries: UN classificationLebanonLesothoLiberiaLibyaLiechtensteinLithuaniaLow & middle incomeLow incomeLower middle incomeLuxembourgMacedonia, FYRMadagascarMalawiMalaysiaMaldivesMaliMaltaMarshall IslandsMauritaniaMauritiusMexicoMicronesia, Fed. Sts.Middle East & North AfricaMiddle East & North Africa (excluding high income)Middle East & North Africa (IDA & IBRD countries)Middle incomeMoldovaMongoliaMontenegroMoroccoMozambiqueMyanmarNamibiaNepalNetherlandsNew CaledoniaNew ZealandNicaraguaNigerNigeriaNorth AmericaNorthern Mariana IslandsNorwayOECD membersOmanOther small statesPacific island small statesPakistanPalauPanamaPapua New GuineaParaguayPeruPhilippinesPolandPortugalPost-demographic dividendPre-demographic dividendPuerto RicoQatarRomaniaRussian FederationRwandaSamoaSan MarinoSao Tome and PrincipeSaudi ArabiaSenegalSerbiaSeychellesSierra LeoneSingaporeSlovak RepublicSloveniaSmall statesSolomon IslandsSomaliaSouth AfricaSouth AsiaSouth Asia (IDA & IBRD)SpainSri LankaSt. Kitts and NevisSt. LuciaSt. Vincent and the GrenadinesSub-Saharan Africa Sub-Saharan Africa (excluding high income)Sub-Saharan Africa (IDA & IBRD countries)SudanSurinameSwazilandSwedenSwitzerlandSyrian Arab RepublicTajikistanTanzaniaThailandTimor-LesteTogoTongaTrinidad and TobagoTunisiaTurkeyTurkmenistanTurks and Caicos IslandsUgandaUkraineUnited Arab EmiratesUnited KingdomUnited StatesUpper middle incomeUruguayUzbekistanVanuatuVenezuela, RBVietnamVirgin Islands (U.S.)West Bank and GazaWorldYemen, Rep.ZambiaZimbabwe Linha do tempo:
Nesta escala de tempo está apresentado um gráfico de 1962 ano até 2015 ano Cuba. Dados de 1961 ano ausente. O número de observações reais por data: 54.
Fonte (nome):
Indicadores de desenvolvimento mundial
Fonte (organização):
Food and Agriculture Organization, electronic files and web site.
Categorias:
Agriculture & Rural Development, Climate Change, Environment
Foi atualizado:
23 abr 2017 ano
Indicadores de alterações dos valores ao longo dos anos
Mínimo:
13.501
1 jan 1962 ano
Máximo:
35.699
1 jan 2003 ano
Na data de observação
Valor
Mudança absoluta
A alteração em relação ao valor anterior
1 jan 1962 ano
13.501
+13.501
0.0%
1 jan 1963 ano
14.013
+0.512
3.79%
1 jan 1964 ano
14.823
+0.81
5.78%
1 jan 1965 ano
16.406
+1.583
10.68%
1 jan 1966 ano
15.084
-1.322
-8.06%
1 jan 1967 ano
14.441
-0.642
-4.26%
1 jan 1968 ano
15.764
+1.322
9.16%
1 jan 1969 ano
18.128
+2.365
15.0%
1 jan 1970 ano
18.091
-0.037
-0.21%
1 jan 1971 ano
21.508
+3.417
18.89%
1 jan 1972 ano
21.201
-0.307
-1.43%
1 jan 1973 ano
24.302
+3.101
14.62%
1 jan 1974 ano
25.922
+1.62
6.67%
1 jan 1975 ano
24.544
-1.378
-5.32%
1 jan 1976 ano
26.723
+2.179
8.88%
1 jan 1977 ano
28.184
+1.462
5.47%
1 jan 1978 ano
28.222
+0.037
0.13%
1 jan 1979 ano
28.268
+0.047
0.16%
1 jan 1980 ano
27.737
-0.531
-1.88%
1 jan 1981 ano
27.747
+0.009
0.03%
1 jan 1982 ano
27.933
+0.186
0.67%
1 jan 1983 ano
28.399
+0.466
1.67%
1 jan 1984 ano
28.864
+0.466
1.64%
1 jan 1985 ano
28.929
+0.065
0.23%
1 jan 1986 ano
29.497
+0.568
1.96%
1 jan 1987 ano
30.261
+0.764
2.59%
1 jan 1988 ano
31.006
+0.745
2.46%
1 jan 1989 ano
31.471
+0.466
1.5%
1 jan 1990 ano
31.667
+0.196
0.62%
1 jan 1991 ano
31.574
-0.093
-0.29%
1 jan 1992 ano
31.983
+0.41
1.3%
1 jan 1993 ano
33.287
+1.304
4.08%
1 jan 1994 ano
33.799
+0.512
1.54%
1 jan 1995 ano
34.32
+0.521
1.54%
1 jan 1996 ano
34.302
-0.019
-0.05%
1 jan 1997 ano
32.449
-1.853
-5.4%
1 jan 1998 ano
33.78
+1.331
4.1%
1 jan 1999 ano
33.277
-0.503
-1.49%
1 jan 2000 ano
33.613
+0.335
1.01%
1 jan 2001 ano
32.626
-0.987
-2.94%
1 jan 2002 ano
34.814
+2.188
6.71%
1 jan 2003 ano
35.699
+0.885
2.54%
1 jan 2004 ano
35.263
-0.436
-1.22%
1 jan 2005 ano
34.828
-0.436
-1.24%
1 jan 2006 ano
34.498
-0.329
-0.95%
1 jan 2007 ano
34.145
-0.354
-1.03%
1 jan 2008 ano
33.568
-0.576
-1.69%
1 jan 2009 ano
32.963
-0.605
-1.8%
1 jan 2010 ano
32.375
-0.588
-1.78%
1 jan 2011 ano
31.793
-0.582
-1.8%
1 jan 2012 ano
31.079
-0.714
-2.24%
1 jan 2013 ano
29.45
-1.629
-5.24%
1 jan 2014 ano
30.284
+0.834
2.83%
1 jan 2015 ano
29.687
-0.597
-1.97%
Classificação de países por estatísticas atuais por anos


Comentários: