29
/pt/
pt
AIzaSyAYiBZKx7MnpbEhh9jyipgxe19OcubqV5w
April 1, 2024
256346
Sweden
SWE
true
2
1
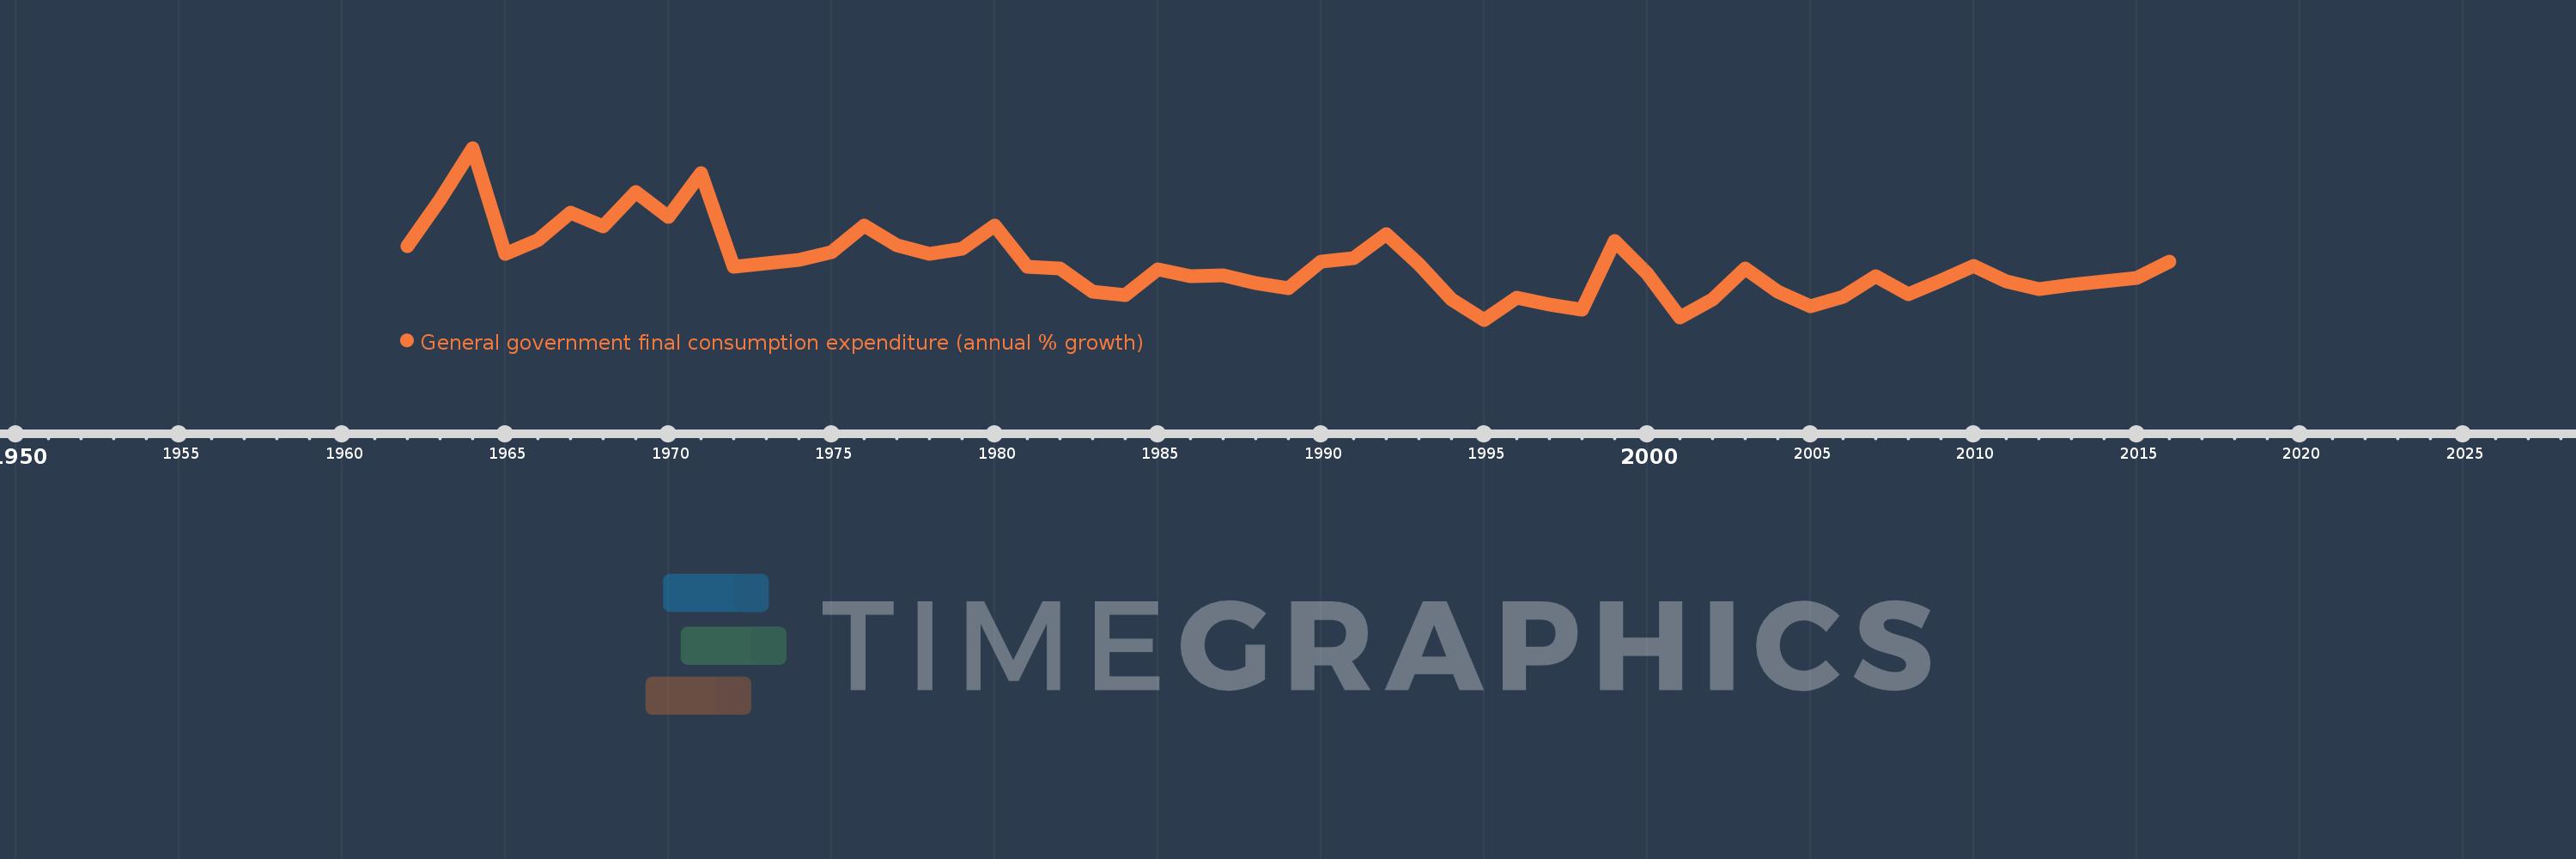
General government final consumption expenditure (annual % growth)
2016,2015,2014,2013,2012,2011,2010,2009,2008,2007,2006,2005,2004,2003,2002,2001,2000,1999,1998,1997,1996,1995,1994,1993,1992,1991,1990,1989,1988,1987,1986,1985,1984,1983,1982,1981,1980,1979,1978,1977,1976,1975,1974,1973,1972,1971,1970,1969,1968,1967,1966,1965,1964,1963,1962
Estas estatísticas em outros países:
AlbaniaAlgeriaAntigua and BarbudaArab WorldArgentinaArmeniaAustraliaAustriaAzerbaijanBahamas, TheBahrainBangladeshBarbadosBelarusBelgiumBelizeBeninBhutanBoliviaBosnia and HerzegovinaBotswanaBrazilBrunei DarussalamBulgariaBurkina FasoBurundiCabo VerdeCambodiaCameroonCanadaCaribbean small statesCentral Europe and the BalticsChadChileChinaColombiaComorosCongo, Dem. Rep.Congo, Rep.Costa RicaCote d'IvoireCroatiaCubaCyprusCzech RepublicDenmarkDjiboutiDominican RepublicEarly-demographic dividendEast Asia & PacificEast Asia & Pacific (excluding high income)East Asia & Pacific (IDA & IBRD countries)EcuadorEgypt, Arab Rep.El SalvadorEquatorial GuineaEritreaEstoniaEthiopiaEuro areaEurope & Central AsiaEurope & Central Asia (excluding high income)Europe & Central Asia (IDA & IBRD countries)European UnionFijiFinlandFranceGabonGambia, TheGeorgiaGermanyGhanaGreeceGuatemalaGuineaGuinea-BissauHaitiHeavily indebted poor countries (HIPC)High incomeHondurasHong Kong SAR, ChinaHungaryIBRD onlyIcelandIDA & IBRD totalIDA blendIDA onlyIDA totalIndiaIndonesiaIran, Islamic Rep.IrelandIsraelItalyJamaicaJapanJordanKazakhstanKenyaKorea, Rep.KosovoKuwaitKyrgyz RepublicLao PDRLate-demographic dividendLatin America & Caribbean Latin America & Caribbean (excluding high income)Latin America & the Caribbean (IDA & IBRD countries)LatviaLebanonLiberiaLithuaniaLow & middle incomeLow incomeLower middle incomeLuxembourgMacao SAR, ChinaMacedonia, FYRMadagascarMalawiMalaysiaMaliMaltaMauritaniaMauritiusMexicoMiddle East & North AfricaMiddle East & North Africa (excluding high income)Middle East & North Africa (IDA & IBRD countries)Middle incomeMoldovaMongoliaMontenegroMoroccoMozambiqueNamibiaNepalNetherlandsNew ZealandNicaraguaNigerNigeriaNorth AmericaNorwayOECD membersOmanOther small statesPakistanPanamaPapua New GuineaParaguayPeruPhilippinesPolandPortugalPost-demographic dividendPuerto RicoQatarRomaniaRussian FederationRwandaSaudi ArabiaSenegalSerbiaSeychellesSierra LeoneSingaporeSlovak RepublicSloveniaSmall statesSomaliaSouth AfricaSouth AsiaSouth Asia (IDA & IBRD)South SudanSpainSri LankaSub-Saharan Africa Sub-Saharan Africa (excluding high income)Sub-Saharan Africa (IDA & IBRD countries)SudanSurinameSwazilandSwedenSwitzerlandSyrian Arab RepublicTajikistanTanzaniaThailandTimor-LesteTogoTrinidad and TobagoTunisiaTurkeyTurkmenistanUgandaUkraineUnited Arab EmiratesUnited KingdomUnited StatesUpper middle incomeUruguayVanuatuVenezuela, RBVietnamWest Bank and GazaWorldZimbabwe Linha do tempo:
Nesta escala de tempo está apresentado um gráfico de 1962 ano até 2016 ano Sweden. Dados de 1961 ano ausente. O número de observações reais por data: 55.
Fonte (nome):
Indicadores de desenvolvimento mundial
Fonte (organização):
World Bank national accounts data, and OECD National Accounts data files.
Categorias:
Economy & Growth
Foi atualizado:
23 abr 2017 ano
Indicadores de alterações dos valores ao longo dos anos
Mínimo:
-1.062
1 jan 1995 ano
Máximo:
9.485
1 jan 1964 ano
Na data de observação
Valor
Mudança absoluta
A alteração em relação ao valor anterior
1 jan 1962 ano
3.432
+3.432
0.0%
1 jan 1963 ano
6.296
+2.864
83.45%
1 jan 1964 ano
9.485
+3.189
50.66%
1 jan 1965 ano
2.982
-6.503
-68.56%
1 jan 1966 ano
3.839
+0.857
28.74%
1 jan 1967 ano
5.531
+1.692
44.08%
1 jan 1968 ano
4.656
-0.875
-15.82%
1 jan 1969 ano
6.788
+2.132
45.78%
1 jan 1970 ano
5.246
-1.542
-22.71%
1 jan 1971 ano
7.939
+2.692
51.32%
1 jan 1972 ano
2.2
-5.739
-72.29%
1 jan 1973 ano
2.4
+0.2
9.09%
1 jan 1974 ano
2.6
+0.2
8.34%
1 jan 1975 ano
3.1
+0.5
19.22%
1 jan 1976 ano
4.7
+1.6
51.62%
1 jan 1977 ano
3.5
-1.2
-25.53%
1 jan 1978 ano
3.0
-0.5
-14.29%
1 jan 1979 ano
3.3
+0.3
10.0%
1 jan 1980 ano
4.7
+1.4
42.43%
1 jan 1981 ano
2.2
-2.5
-53.19%
1 jan 1982 ano
2.086
-0.114
-5.19%
1 jan 1983 ano
0.684
-1.401
-67.18%
1 jan 1984 ano
0.477
-0.207
-30.25%
1 jan 1985 ano
2.042
+1.565
327.81%
1 jan 1986 ano
1.613
-0.429
-21.02%
1 jan 1987 ano
1.682
+0.069
4.26%
1 jan 1988 ano
1.209
-0.473
-28.12%
1 jan 1989 ano
0.883
-0.326
-26.99%
1 jan 1990 ano
2.482
+1.599
181.14%
1 jan 1991 ano
2.743
+0.261
10.53%
1 jan 1992 ano
4.187
+1.444
52.64%
1 jan 1993 ano
2.328
-1.859
-44.39%
1 jan 1994 ano
0.198
-2.13
-91.5%
1 jan 1995 ano
-1.062
-1.26
-636.52%
1 jan 1996 ano
0.302
+1.364
-128.46%
1 jan 1997 ano
-0.126
-0.428
-141.73%
1 jan 1998 ano
-0.461
-0.335
265.28%
1 jan 1999 ano
3.795
+4.255
-923.73%
1 jan 2000 ano
1.749
-2.046
-53.91%
1 jan 2001 ano
-0.907
-2.656
-151.86%
1 jan 2002 ano
0.172
+1.079
-118.95%
1 jan 2003 ano
2.099
+1.927
1.12 mil%
1 jan 2004 ano
0.671
-1.428
-68.05%
1 jan 2005 ano
-0.23
-0.901
-134.27%
1 jan 2006 ano
0.372
+0.602
-261.75%
1 jan 2007 ano
1.612
+1.24
333.39%
1 jan 2008 ano
0.501
-1.11
-68.88%
1 jan 2009 ano
1.336
+0.834
166.38%
1 jan 2010 ano
2.255
+0.919
68.81%
1 jan 2011 ano
1.314
-0.941
-41.73%
1 jan 2012 ano
0.826
-0.488
-37.13%
1 jan 2013 ano
1.108
+0.282
34.11%
1 jan 2014 ano
1.291
+0.183
16.47%
1 jan 2015 ano
1.511
+0.221
17.12%
1 jan 2016 ano
2.488
+0.976
64.6%
Classificação de países por estatísticas atuais por anos


Comentários: