29
/pt/
pt
AIzaSyAYiBZKx7MnpbEhh9jyipgxe19OcubqV5w
April 1, 2024
161477
Italy
ITA
true
2
1
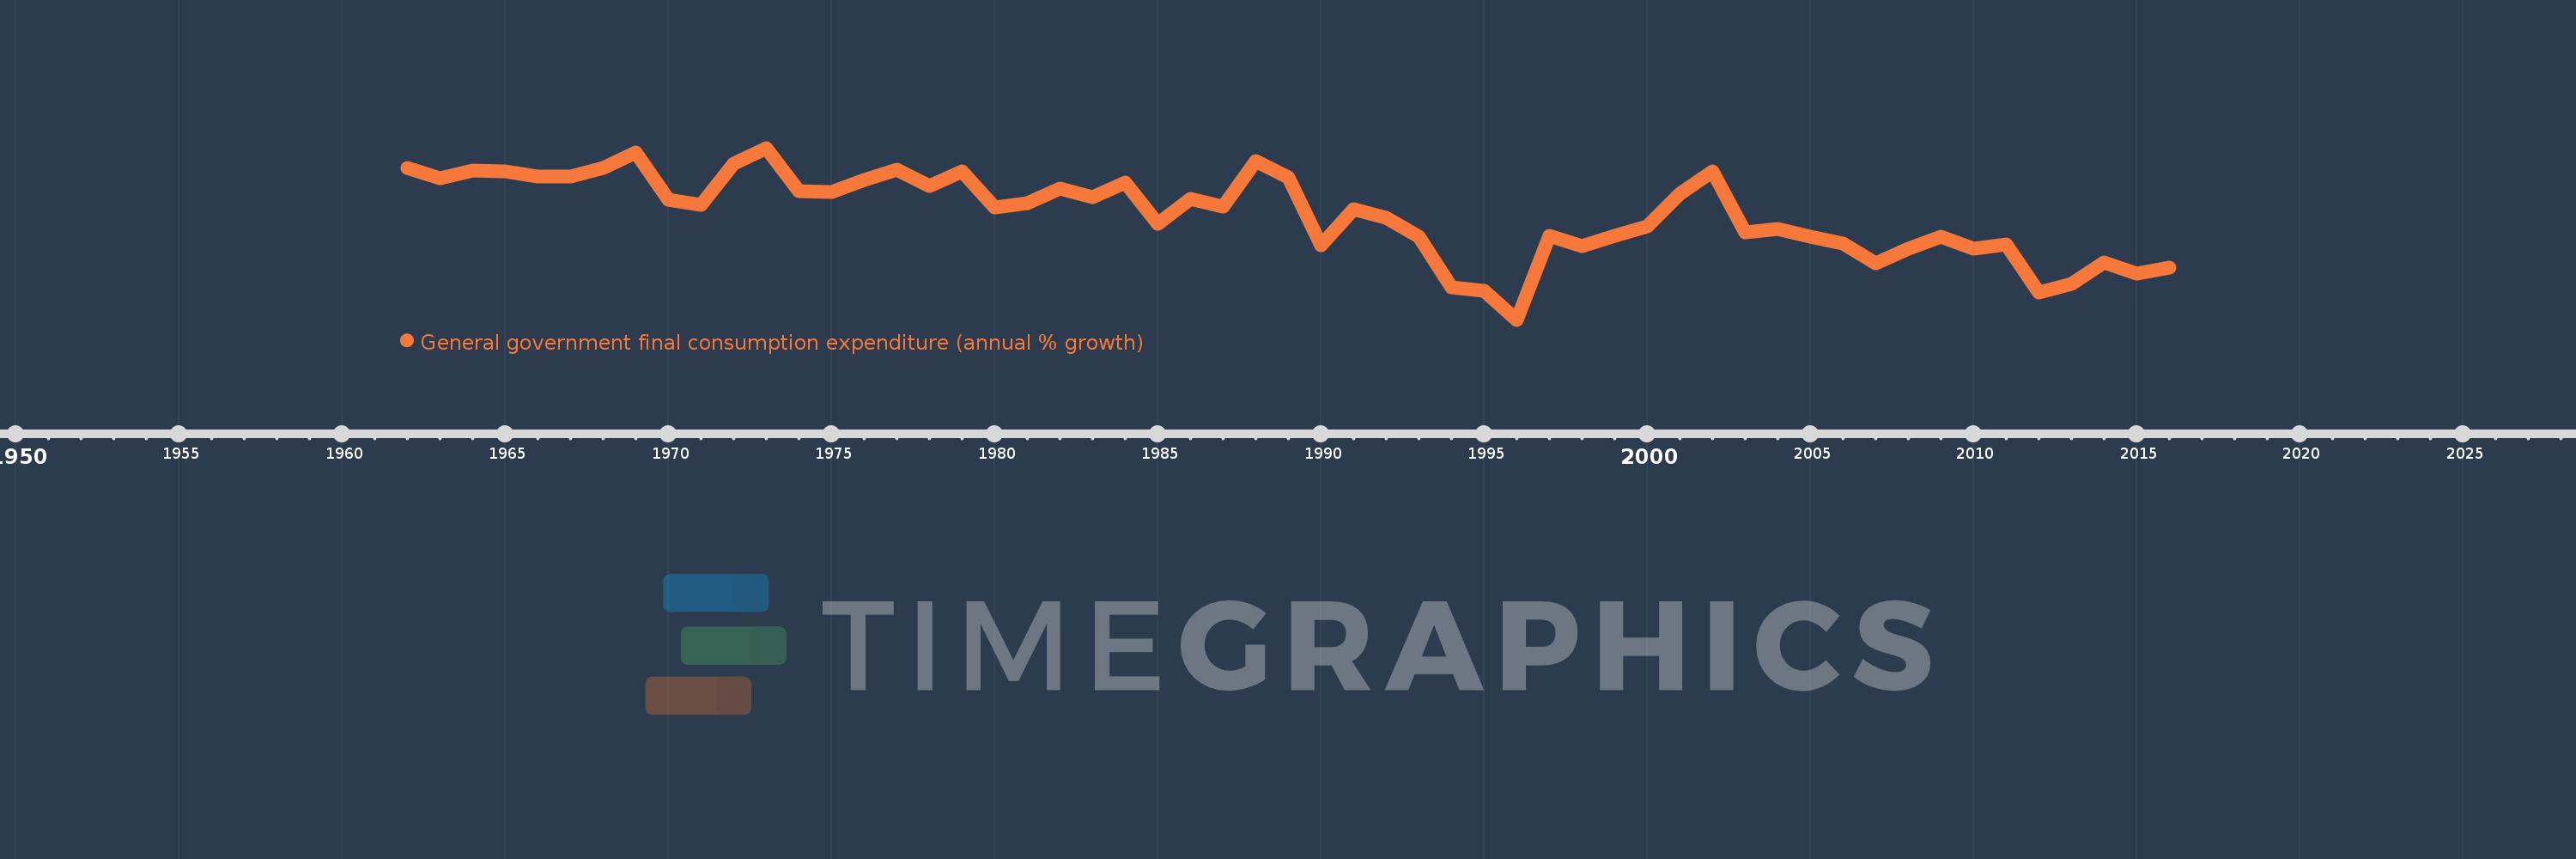
General government final consumption expenditure (annual % growth)
2016,2015,2014,2013,2012,2011,2010,2009,2008,2007,2006,2005,2004,2003,2002,2001,2000,1999,1998,1997,1996,1995,1994,1993,1992,1991,1990,1989,1988,1987,1986,1985,1984,1983,1982,1981,1980,1979,1978,1977,1976,1975,1974,1973,1972,1971,1970,1969,1968,1967,1966,1965,1964,1963,1962
Estas estatísticas em outros países:
AlbaniaAlgeriaAntigua and BarbudaArab WorldArgentinaArmeniaAustraliaAustriaAzerbaijanBahamas, TheBahrainBangladeshBarbadosBelarusBelgiumBelizeBeninBhutanBoliviaBosnia and HerzegovinaBotswanaBrazilBrunei DarussalamBulgariaBurkina FasoBurundiCabo VerdeCambodiaCameroonCanadaCaribbean small statesCentral Europe and the BalticsChadChileChinaColombiaComorosCongo, Dem. Rep.Congo, Rep.Costa RicaCote d'IvoireCroatiaCubaCyprusCzech RepublicDenmarkDjiboutiDominican RepublicEarly-demographic dividendEast Asia & PacificEast Asia & Pacific (excluding high income)East Asia & Pacific (IDA & IBRD countries)EcuadorEgypt, Arab Rep.El SalvadorEquatorial GuineaEritreaEstoniaEthiopiaEuro areaEurope & Central AsiaEurope & Central Asia (excluding high income)Europe & Central Asia (IDA & IBRD countries)European UnionFijiFinlandFranceGabonGambia, TheGeorgiaGermanyGhanaGreeceGuatemalaGuineaGuinea-BissauHaitiHeavily indebted poor countries (HIPC)High incomeHondurasHong Kong SAR, ChinaHungaryIBRD onlyIcelandIDA & IBRD totalIDA blendIDA onlyIDA totalIndiaIndonesiaIran, Islamic Rep.IrelandIsraelItalyJamaicaJapanJordanKazakhstanKenyaKorea, Rep.KosovoKuwaitKyrgyz RepublicLao PDRLate-demographic dividendLatin America & Caribbean Latin America & Caribbean (excluding high income)Latin America & the Caribbean (IDA & IBRD countries)LatviaLebanonLiberiaLithuaniaLow & middle incomeLow incomeLower middle incomeLuxembourgMacao SAR, ChinaMacedonia, FYRMadagascarMalawiMalaysiaMaliMaltaMauritaniaMauritiusMexicoMiddle East & North AfricaMiddle East & North Africa (excluding high income)Middle East & North Africa (IDA & IBRD countries)Middle incomeMoldovaMongoliaMontenegroMoroccoMozambiqueNamibiaNepalNetherlandsNew ZealandNicaraguaNigerNigeriaNorth AmericaNorwayOECD membersOmanOther small statesPakistanPanamaPapua New GuineaParaguayPeruPhilippinesPolandPortugalPost-demographic dividendPuerto RicoQatarRomaniaRussian FederationRwandaSaudi ArabiaSenegalSerbiaSeychellesSierra LeoneSingaporeSlovak RepublicSloveniaSmall statesSomaliaSouth AfricaSouth AsiaSouth Asia (IDA & IBRD)South SudanSpainSri LankaSub-Saharan Africa Sub-Saharan Africa (excluding high income)Sub-Saharan Africa (IDA & IBRD countries)SudanSurinameSwazilandSwedenSwitzerlandSyrian Arab RepublicTajikistanTanzaniaThailandTimor-LesteTogoTrinidad and TobagoTunisiaTurkeyTurkmenistanUgandaUkraineUnited Arab EmiratesUnited KingdomUnited StatesUpper middle incomeUruguayVanuatuVenezuela, RBVietnamWest Bank and GazaWorldZimbabwe Linha do tempo:
Nesta escala de tempo está apresentado um gráfico de 1962 ano até 2016 ano Italy. Dados de 1961 ano ausente. O número de observações reais por data: 55.
Fonte (nome):
Indicadores de desenvolvimento mundial
Fonte (organização):
World Bank national accounts data, and OECD National Accounts data files.
Categorias:
Economy & Growth
Foi atualizado:
23 abr 2017 ano
Indicadores de alterações dos valores ao longo dos anos
Mínimo:
-3.183
1 jan 1996 ano
Máximo:
5.397
1 jan 1973 ano
Na data de observação
Valor
Mudança absoluta
A alteração em relação ao valor anterior
1 jan 1962 ano
4.376
+4.376
0.0%
1 jan 1963 ano
3.895
-0.481
-10.99%
1 jan 1964 ano
4.285
+0.39
10.02%
1 jan 1965 ano
4.231
-0.054
-1.27%
1 jan 1966 ano
3.957
-0.273
-6.46%
1 jan 1967 ano
3.959
+0.002
0.04%
1 jan 1968 ano
4.383
+0.423
10.7%
1 jan 1969 ano
5.184
+0.802
18.3%
1 jan 1970 ano
2.799
-2.385
-46.01%
1 jan 1971 ano
2.569
-0.231
-8.24%
1 jan 1972 ano
4.619
+2.051
79.83%
1 jan 1973 ano
5.397
+0.778
16.83%
1 jan 1974 ano
3.219
-2.177
-40.35%
1 jan 1975 ano
3.187
-0.032
-1.0%
1 jan 1976 ano
3.795
+0.608
19.09%
1 jan 1977 ano
4.331
+0.536
14.12%
1 jan 1978 ano
3.477
-0.855
-19.73%
1 jan 1979 ano
4.218
+0.742
21.34%
1 jan 1980 ano
2.415
-1.804
-42.76%
1 jan 1981 ano
2.625
+0.211
8.73%
1 jan 1982 ano
3.359
+0.734
27.95%
1 jan 1983 ano
2.941
-0.418
-12.44%
1 jan 1984 ano
3.67
+0.729
24.79%
1 jan 1985 ano
1.591
-2.079
-56.65%
1 jan 1986 ano
2.844
+1.253
78.75%
1 jan 1987 ano
2.46
-0.384
-13.5%
1 jan 1988 ano
4.746
+2.286
92.9%
1 jan 1989 ano
3.934
-0.812
-17.11%
1 jan 1990 ano
0.517
-3.417
-86.86%
1 jan 1991 ano
2.347
+1.83
353.98%
1 jan 1992 ano
1.901
-0.446
-19.02%
1 jan 1993 ano
0.954
-0.946
-49.8%
1 jan 1994 ano
-1.546
-2.5
-262.01%
1 jan 1995 ano
-1.74
-0.194
12.56%
1 jan 1996 ano
-3.183
-1.443
82.92%
1 jan 1997 ano
0.995
+4.178
-131.26%
1 jan 1998 ano
0.511
-0.484
-48.64%
1 jan 1999 ano
0.998
+0.487
95.25%
1 jan 2000 ano
1.467
+0.469
47.0%
1 jan 2001 ano
3.103
+1.637
111.62%
1 jan 2002 ano
4.23
+1.127
36.31%
1 jan 2003 ano
1.165
-3.066
-72.47%
1 jan 2004 ano
1.343
+0.179
15.33%
1 jan 2005 ano
0.963
-0.381
-28.34%
1 jan 2006 ano
0.64
-0.322
-33.47%
1 jan 2007 ano
-0.376
-1.017
-158.75%
1 jan 2008 ano
0.354
+0.73
-194.09%
1 jan 2009 ano
0.967
+0.613
173.33%
1 jan 2010 ano
0.373
-0.595
-61.45%
1 jan 2011 ano
0.569
+0.197
52.71%
1 jan 2012 ano
-1.817
-2.387
-419.12%
1 jan 2013 ano
-1.379
+0.439
-24.13%
1 jan 2014 ano
-0.308
+1.071
-77.66%
1 jan 2015 ano
-0.862
-0.554
179.71%
1 jan 2016 ano
-0.567
+0.295
-34.18%
Classificação de países por estatísticas atuais por anos


Comentários: