29
/pt/
pt
AIzaSyAYiBZKx7MnpbEhh9jyipgxe19OcubqV5w
April 1, 2024
108524
Comoros
COM
true
2
1
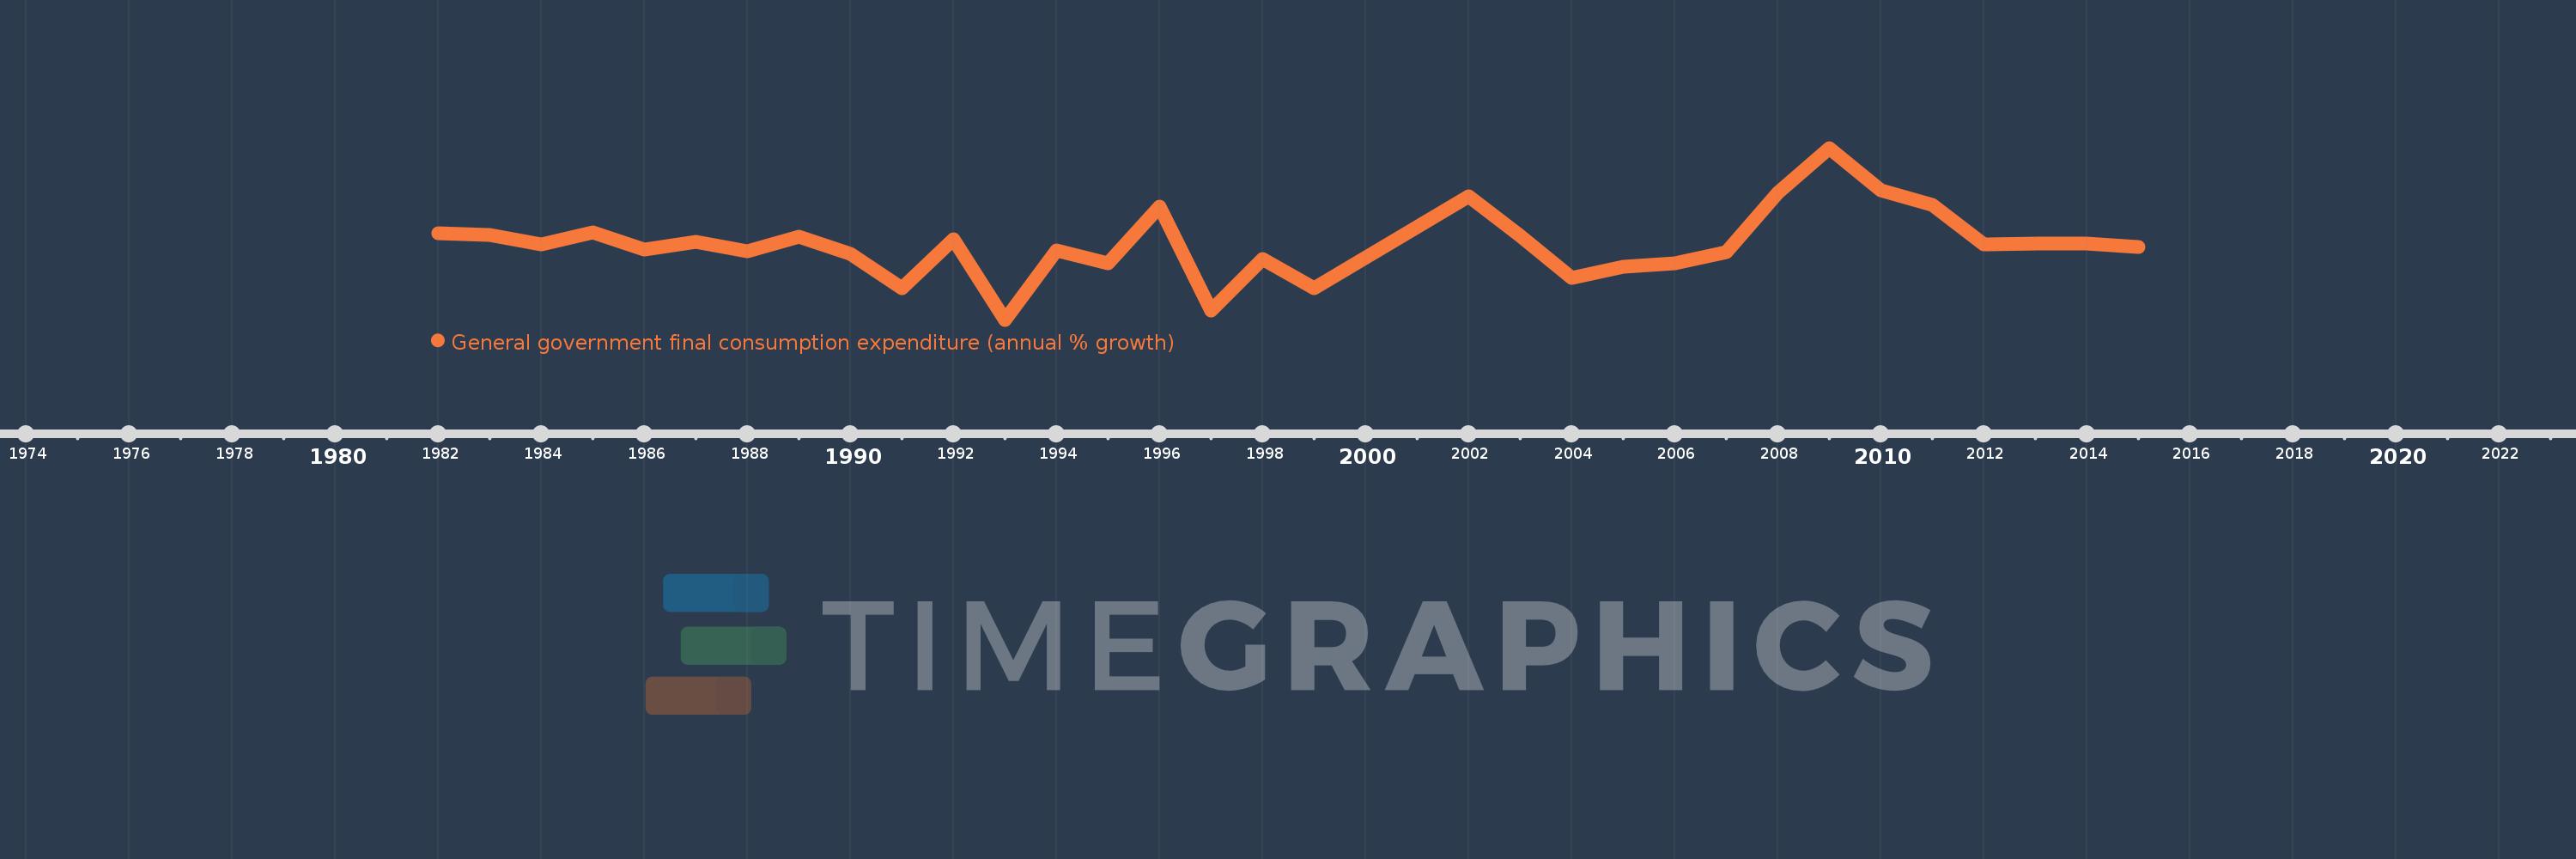
General government final consumption expenditure (annual % growth)
2015,2014,2013,2012,2011,2010,2009,2008,2007,2006,2005,2004,2003,2002,1999,1998,1997,1996,1995,1994,1993,1992,1991,1990,1989,1988,1987,1986,1985,1984,1983,1982
Estas estatísticas em outros países:
AlbaniaAlgeriaAntigua and BarbudaArab WorldArgentinaArmeniaAustraliaAustriaAzerbaijanBahamas, TheBahrainBangladeshBarbadosBelarusBelgiumBelizeBeninBhutanBoliviaBosnia and HerzegovinaBotswanaBrazilBrunei DarussalamBulgariaBurkina FasoBurundiCabo VerdeCambodiaCameroonCanadaCaribbean small statesCentral Europe and the BalticsChadChileChinaColombiaComorosCongo, Dem. Rep.Congo, Rep.Costa RicaCote d'IvoireCroatiaCubaCyprusCzech RepublicDenmarkDjiboutiDominican RepublicEarly-demographic dividendEast Asia & PacificEast Asia & Pacific (excluding high income)East Asia & Pacific (IDA & IBRD countries)EcuadorEgypt, Arab Rep.El SalvadorEquatorial GuineaEritreaEstoniaEthiopiaEuro areaEurope & Central AsiaEurope & Central Asia (excluding high income)Europe & Central Asia (IDA & IBRD countries)European UnionFijiFinlandFranceGabonGambia, TheGeorgiaGermanyGhanaGreeceGuatemalaGuineaGuinea-BissauHaitiHeavily indebted poor countries (HIPC)High incomeHondurasHong Kong SAR, ChinaHungaryIBRD onlyIcelandIDA & IBRD totalIDA blendIDA onlyIDA totalIndiaIndonesiaIran, Islamic Rep.IrelandIsraelItalyJamaicaJapanJordanKazakhstanKenyaKorea, Rep.KosovoKuwaitKyrgyz RepublicLao PDRLate-demographic dividendLatin America & Caribbean Latin America & Caribbean (excluding high income)Latin America & the Caribbean (IDA & IBRD countries)LatviaLebanonLiberiaLithuaniaLow & middle incomeLow incomeLower middle incomeLuxembourgMacao SAR, ChinaMacedonia, FYRMadagascarMalawiMalaysiaMaliMaltaMauritaniaMauritiusMexicoMiddle East & North AfricaMiddle East & North Africa (excluding high income)Middle East & North Africa (IDA & IBRD countries)Middle incomeMoldovaMongoliaMontenegroMoroccoMozambiqueNamibiaNepalNetherlandsNew ZealandNicaraguaNigerNigeriaNorth AmericaNorwayOECD membersOmanOther small statesPakistanPanamaPapua New GuineaParaguayPeruPhilippinesPolandPortugalPost-demographic dividendPuerto RicoQatarRomaniaRussian FederationRwandaSaudi ArabiaSenegalSerbiaSeychellesSierra LeoneSingaporeSlovak RepublicSloveniaSmall statesSomaliaSouth AfricaSouth AsiaSouth Asia (IDA & IBRD)South SudanSpainSri LankaSub-Saharan Africa Sub-Saharan Africa (excluding high income)Sub-Saharan Africa (IDA & IBRD countries)SudanSurinameSwazilandSwedenSwitzerlandSyrian Arab RepublicTajikistanTanzaniaThailandTimor-LesteTogoTrinidad and TobagoTunisiaTurkeyTurkmenistanUgandaUkraineUnited Arab EmiratesUnited KingdomUnited StatesUpper middle incomeUruguayVanuatuVenezuela, RBVietnamWest Bank and GazaWorldZimbabwe Linha do tempo:
Nesta escala de tempo está apresentado um gráfico de 1982 ano até 2015 ano Comoros. Dados de 1981 ano ausente. O número de observações reais por data: 32.
Fonte (nome):
Indicadores de desenvolvimento mundial
Fonte (organização):
World Bank national accounts data, and OECD National Accounts data files.
Categorias:
Economy & Growth
Foi atualizado:
23 abr 2017 ano
Indicadores de alterações dos valores ao longo dos anos
Mínimo:
-15.967
1 jan 1993 ano
Máximo:
24.978
1 jan 2009 ano
Na data de observação
Valor
Mudança absoluta
A alteração em relação ao valor anterior
1 jan 1982 ano
4.74
+4.74
0.0%
1 jan 1983 ano
4.328
-0.411
-8.68%
1 jan 1984 ano
1.911
-2.417
-55.85%
1 jan 1985 ano
4.861
+2.95
154.35%
1 jan 1986 ano
0.682
-4.178
-85.96%
1 jan 1987 ano
2.553
+1.871
274.17%
1 jan 1988 ano
0.319
-2.234
-87.5%
1 jan 1989 ano
3.748
+3.429
1.07 mil%
1 jan 1990 ano
-0.17
-3.918
-104.53%
1 jan 1991 ano
-8.466
-8.296
4.89 mil%
1 jan 1992 ano
3.117
+11.583
-136.82%
1 jan 1993 ano
-15.967
-19.084
-612.24%
1 jan 1994 ano
0.578
+16.545
-103.62%
1 jan 1995 ano
-2.509
-3.087
-534.05%
1 jan 1996 ano
10.962
+13.471
-536.97%
1 jan 1997 ano
-13.771
-24.734
-225.63%
1 jan 1998 ano
-1.537
+12.235
-88.84%
1 jan 1999 ano
-8.383
-6.846
445.5%
1 jan 2002 ano
13.446
+21.829
-260.4%
1 jan 2003 ano
4.124
-9.322
-69.33%
1 jan 2004 ano
-5.953
-10.077
-244.35%
1 jan 2005 ano
-3.234
+2.719
-45.67%
1 jan 2006 ano
-2.42
+0.815
-25.19%
1 jan 2007 ano
0.043
+2.463
-101.78%
1 jan 2008 ano
14.319
+14.276
33.11 mil%
1 jan 2009 ano
24.978
+10.659
74.44%
1 jan 2010 ano
14.845
-10.133
-40.57%
1 jan 2011 ano
11.338
-3.507
-23.62%
1 jan 2012 ano
2.0
-9.338
-82.36%
1 jan 2013 ano
2.2
+0.2
10.0%
1 jan 2014 ano
2.2
0.0
0.0%
1 jan 2015 ano
1.378
-0.822
-37.37%
Classificação de países por estatísticas atuais por anos


Comentários: