29
/pt/
pt
AIzaSyAYiBZKx7MnpbEhh9jyipgxe19OcubqV5w
April 1, 2024
218348
Panama
PAN
true
2
1
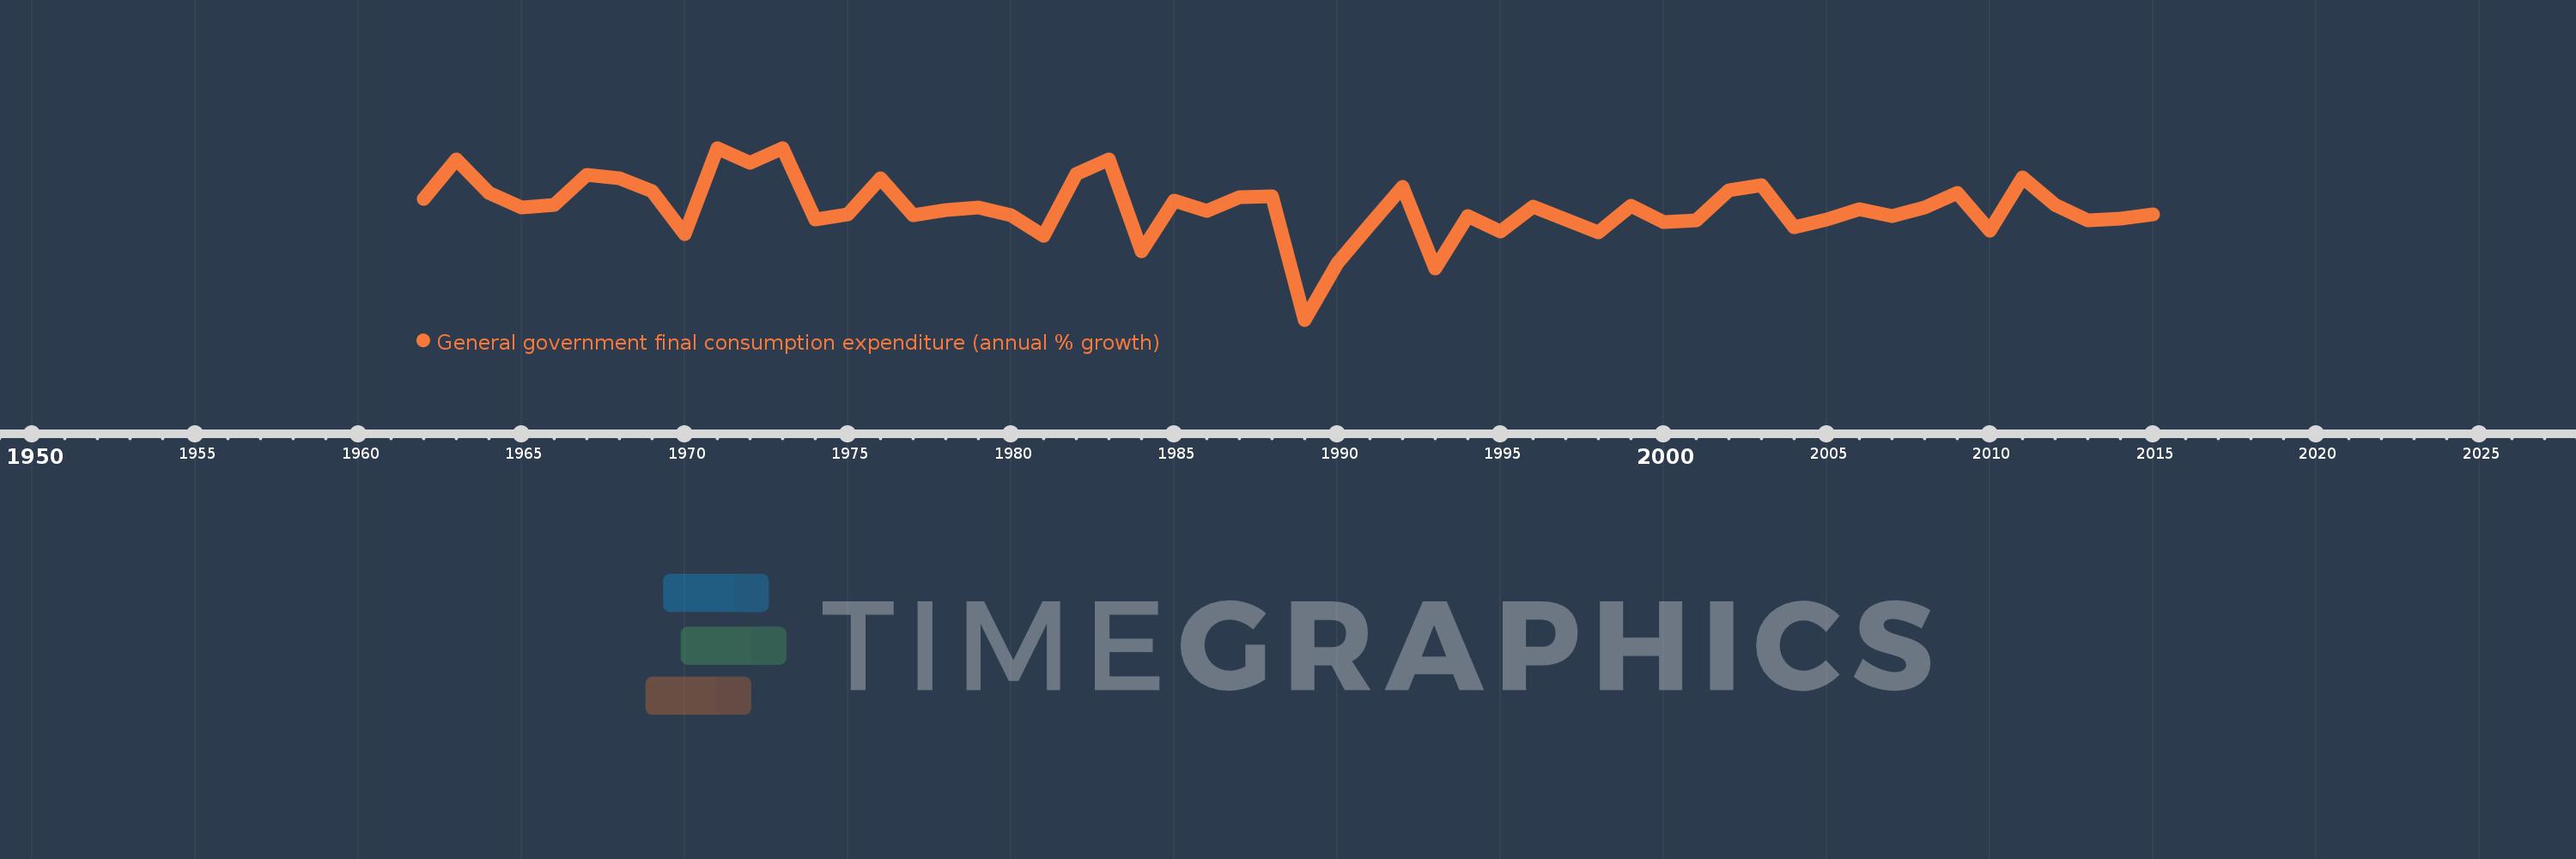
General government final consumption expenditure (annual % growth)
2015,2014,2013,2012,2011,2010,2009,2008,2007,2006,2005,2004,2003,2002,2001,2000,1999,1998,1997,1996,1995,1994,1993,1992,1991,1990,1989,1988,1987,1986,1985,1984,1983,1982,1981,1980,1979,1978,1977,1976,1975,1974,1973,1972,1971,1970,1969,1968,1967,1966,1965,1964,1963,1962
Estas estatísticas em outros países:
AlbaniaAlgeriaAntigua and BarbudaArab WorldArgentinaArmeniaAustraliaAustriaAzerbaijanBahamas, TheBahrainBangladeshBarbadosBelarusBelgiumBelizeBeninBhutanBoliviaBosnia and HerzegovinaBotswanaBrazilBrunei DarussalamBulgariaBurkina FasoBurundiCabo VerdeCambodiaCameroonCanadaCaribbean small statesCentral Europe and the BalticsChadChileChinaColombiaComorosCongo, Dem. Rep.Congo, Rep.Costa RicaCote d'IvoireCroatiaCubaCyprusCzech RepublicDenmarkDjiboutiDominican RepublicEarly-demographic dividendEast Asia & PacificEast Asia & Pacific (excluding high income)East Asia & Pacific (IDA & IBRD countries)EcuadorEgypt, Arab Rep.El SalvadorEquatorial GuineaEritreaEstoniaEthiopiaEuro areaEurope & Central AsiaEurope & Central Asia (excluding high income)Europe & Central Asia (IDA & IBRD countries)European UnionFijiFinlandFranceGabonGambia, TheGeorgiaGermanyGhanaGreeceGuatemalaGuineaGuinea-BissauHaitiHeavily indebted poor countries (HIPC)High incomeHondurasHong Kong SAR, ChinaHungaryIBRD onlyIcelandIDA & IBRD totalIDA blendIDA onlyIDA totalIndiaIndonesiaIran, Islamic Rep.IrelandIsraelItalyJamaicaJapanJordanKazakhstanKenyaKorea, Rep.KosovoKuwaitKyrgyz RepublicLao PDRLate-demographic dividendLatin America & Caribbean Latin America & Caribbean (excluding high income)Latin America & the Caribbean (IDA & IBRD countries)LatviaLebanonLiberiaLithuaniaLow & middle incomeLow incomeLower middle incomeLuxembourgMacao SAR, ChinaMacedonia, FYRMadagascarMalawiMalaysiaMaliMaltaMauritaniaMauritiusMexicoMiddle East & North AfricaMiddle East & North Africa (excluding high income)Middle East & North Africa (IDA & IBRD countries)Middle incomeMoldovaMongoliaMontenegroMoroccoMozambiqueNamibiaNepalNetherlandsNew ZealandNicaraguaNigerNigeriaNorth AmericaNorwayOECD membersOmanOther small statesPakistanPanamaPapua New GuineaParaguayPeruPhilippinesPolandPortugalPost-demographic dividendPuerto RicoQatarRomaniaRussian FederationRwandaSaudi ArabiaSenegalSerbiaSeychellesSierra LeoneSingaporeSlovak RepublicSloveniaSmall statesSomaliaSouth AfricaSouth AsiaSouth Asia (IDA & IBRD)South SudanSpainSri LankaSub-Saharan Africa Sub-Saharan Africa (excluding high income)Sub-Saharan Africa (IDA & IBRD countries)SudanSurinameSwazilandSwedenSwitzerlandSyrian Arab RepublicTajikistanTanzaniaThailandTimor-LesteTogoTrinidad and TobagoTunisiaTurkeyTurkmenistanUgandaUkraineUnited Arab EmiratesUnited KingdomUnited StatesUpper middle incomeUruguayVanuatuVenezuela, RBVietnamWest Bank and GazaWorldZimbabwe Linha do tempo:
Nesta escala de tempo está apresentado um gráfico de 1962 ano até 2015 ano Panama. Dados de 1961 ano ausente. O número de observações reais por data: 54.
Fonte (nome):
Indicadores de desenvolvimento mundial
Fonte (organização):
World Bank national accounts data, and OECD National Accounts data files.
Categorias:
Economy & Growth
Foi atualizado:
23 abr 2017 ano
Indicadores de alterações dos valores ao longo dos anos
Mínimo:
-18.537
1 jan 1989 ano
Máximo:
16.638
1 jan 1973 ano
Na data de observação
Valor
Mudança absoluta
A alteração em relação ao valor anterior
1 jan 1962 ano
6.183
+6.183
0.0%
1 jan 1963 ano
14.257
+8.074
130.57%
1 jan 1964 ano
7.381
-6.876
-48.23%
1 jan 1965 ano
4.419
-2.962
-40.13%
1 jan 1966 ano
5.016
+0.597
13.5%
1 jan 1967 ano
11.194
+6.178
123.18%
1 jan 1968 ano
10.47
-0.724
-6.47%
1 jan 1969 ano
7.776
-2.693
-25.73%
1 jan 1970 ano
-1.015
-8.791
-113.05%
1 jan 1971 ano
16.629
+17.643
-1.74 mil%
1 jan 1972 ano
13.657
-2.971
-17.87%
1 jan 1973 ano
16.638
+2.981
21.82%
1 jan 1974 ano
1.932
-14.706
-88.39%
1 jan 1975 ano
3.11
+1.178
60.99%
1 jan 1976 ano
10.415
+7.305
234.9%
1 jan 1977 ano
2.86
-7.555
-72.54%
1 jan 1978 ano
3.9
+1.041
36.4%
1 jan 1979 ano
4.433
+0.532
13.65%
1 jan 1980 ano
2.906
-1.527
-34.44%
1 jan 1981 ano
-1.375
-4.281
-147.31%
1 jan 1982 ano
11.336
+12.711
-924.47%
1 jan 1983 ano
14.307
+2.971
26.21%
1 jan 1984 ano
-4.563
-18.871
-131.9%
1 jan 1985 ano
5.897
+10.46
-229.21%
1 jan 1986 ano
3.756
-2.141
-36.31%
1 jan 1987 ano
6.622
+2.866
76.33%
1 jan 1988 ano
6.652
+0.03
0.46%
1 jan 1989 ano
-18.537
-25.19
-378.66%
1 jan 1990 ano
-7.047
+11.49
-61.99%
1 jan 1991 ano
0.948
+7.995
-113.45%
1 jan 1992 ano
8.677
+7.73
815.68%
1 jan 1993 ano
-7.951
-16.629
-191.63%
1 jan 1994 ano
2.755
+10.706
-134.65%
1 jan 1995 ano
-0.433
-3.188
-115.72%
1 jan 1996 ano
4.645
+5.078
-1.17 mil%
1 jan 1997 ano
1.97
-2.675
-57.59%
1 jan 1998 ano
-0.637
-2.607
-132.31%
1 jan 1999 ano
4.717
+5.353
-840.97%
1 jan 2000 ano
1.491
-3.225
-68.38%
1 jan 2001 ano
1.786
+0.295
19.75%
1 jan 2002 ano
8.054
+6.268
351.02%
1 jan 2003 ano
9.105
+1.051
13.05%
1 jan 2004 ano
0.427
-8.678
-95.31%
1 jan 2005 ano
1.919
+1.492
349.55%
1 jan 2006 ano
4.147
+2.228
116.05%
1 jan 2007 ano
2.68
-1.467
-35.37%
1 jan 2008 ano
4.52
+1.84
68.67%
1 jan 2009 ano
7.456
+2.935
64.93%
1 jan 2010 ano
-0.23
-7.686
-103.09%
1 jan 2011 ano
10.572
+10.802
-4.69 mil%
1 jan 2012 ano
5.0
-5.572
-52.71%
1 jan 2013 ano
1.875
-3.125
-62.5%
1 jan 2014 ano
2.083
+0.208
11.08%
1 jan 2015 ano
3.033
+0.95
45.62%
Classificação de países por estatísticas atuais por anos


Comentários: