29
/pt/
pt
AIzaSyAYiBZKx7MnpbEhh9jyipgxe19OcubqV5w
April 1, 2024
195560
Mexico
MEX
true
2
1
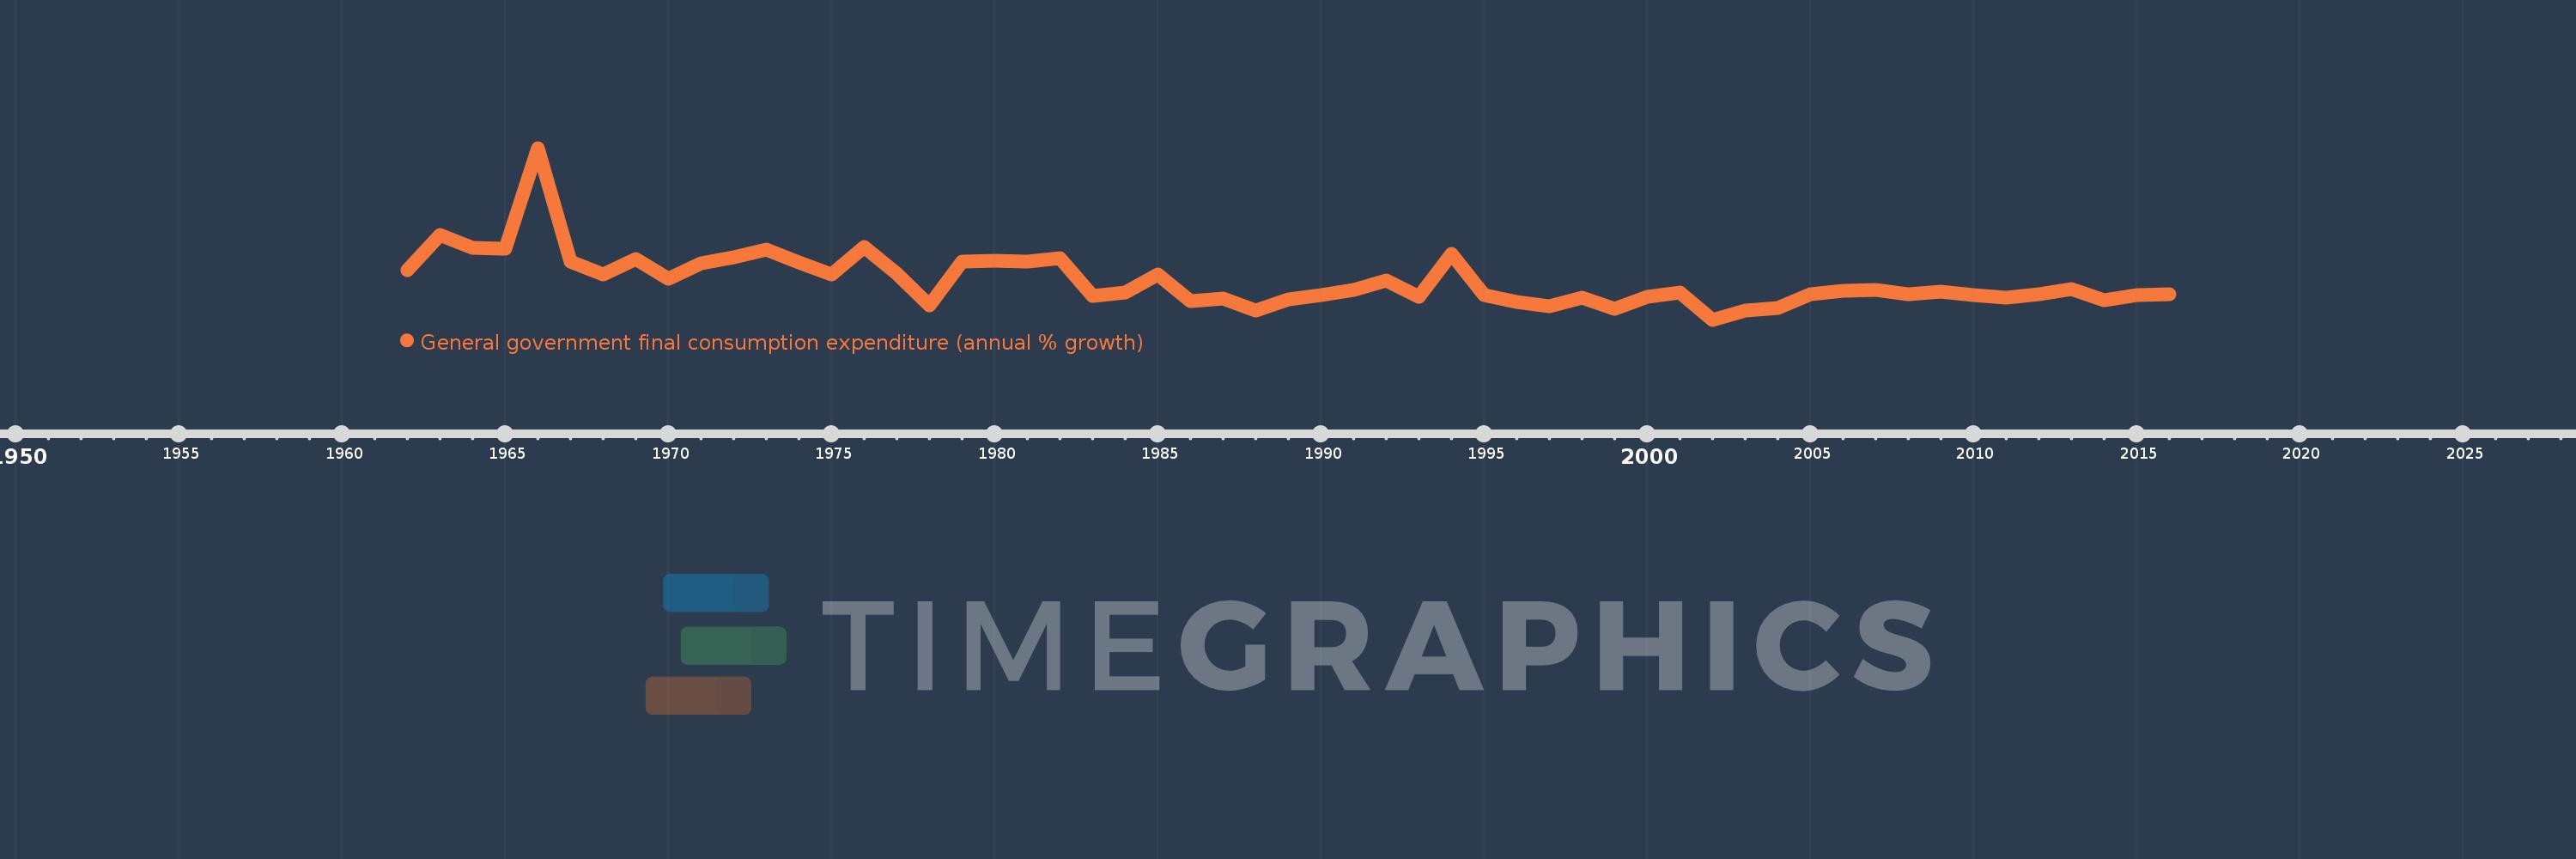
General government final consumption expenditure (annual % growth)
2016,2015,2014,2013,2012,2011,2010,2009,2008,2007,2006,2005,2004,2003,2002,2001,2000,1999,1998,1997,1996,1995,1994,1993,1992,1991,1990,1989,1988,1987,1986,1985,1984,1983,1982,1981,1980,1979,1978,1977,1976,1975,1974,1973,1972,1971,1970,1969,1968,1967,1966,1965,1964,1963,1962
Estas estatísticas em outros países:
AlbaniaAlgeriaAntigua and BarbudaArab WorldArgentinaArmeniaAustraliaAustriaAzerbaijanBahamas, TheBahrainBangladeshBarbadosBelarusBelgiumBelizeBeninBhutanBoliviaBosnia and HerzegovinaBotswanaBrazilBrunei DarussalamBulgariaBurkina FasoBurundiCabo VerdeCambodiaCameroonCanadaCaribbean small statesCentral Europe and the BalticsChadChileChinaColombiaComorosCongo, Dem. Rep.Congo, Rep.Costa RicaCote d'IvoireCroatiaCubaCyprusCzech RepublicDenmarkDjiboutiDominican RepublicEarly-demographic dividendEast Asia & PacificEast Asia & Pacific (excluding high income)East Asia & Pacific (IDA & IBRD countries)EcuadorEgypt, Arab Rep.El SalvadorEquatorial GuineaEritreaEstoniaEthiopiaEuro areaEurope & Central AsiaEurope & Central Asia (excluding high income)Europe & Central Asia (IDA & IBRD countries)European UnionFijiFinlandFranceGabonGambia, TheGeorgiaGermanyGhanaGreeceGuatemalaGuineaGuinea-BissauHaitiHeavily indebted poor countries (HIPC)High incomeHondurasHong Kong SAR, ChinaHungaryIBRD onlyIcelandIDA & IBRD totalIDA blendIDA onlyIDA totalIndiaIndonesiaIran, Islamic Rep.IrelandIsraelItalyJamaicaJapanJordanKazakhstanKenyaKorea, Rep.KosovoKuwaitKyrgyz RepublicLao PDRLate-demographic dividendLatin America & Caribbean Latin America & Caribbean (excluding high income)Latin America & the Caribbean (IDA & IBRD countries)LatviaLebanonLiberiaLithuaniaLow & middle incomeLow incomeLower middle incomeLuxembourgMacao SAR, ChinaMacedonia, FYRMadagascarMalawiMalaysiaMaliMaltaMauritaniaMauritiusMexicoMiddle East & North AfricaMiddle East & North Africa (excluding high income)Middle East & North Africa (IDA & IBRD countries)Middle incomeMoldovaMongoliaMontenegroMoroccoMozambiqueNamibiaNepalNetherlandsNew ZealandNicaraguaNigerNigeriaNorth AmericaNorwayOECD membersOmanOther small statesPakistanPanamaPapua New GuineaParaguayPeruPhilippinesPolandPortugalPost-demographic dividendPuerto RicoQatarRomaniaRussian FederationRwandaSaudi ArabiaSenegalSerbiaSeychellesSierra LeoneSingaporeSlovak RepublicSloveniaSmall statesSomaliaSouth AfricaSouth AsiaSouth Asia (IDA & IBRD)South SudanSpainSri LankaSub-Saharan Africa Sub-Saharan Africa (excluding high income)Sub-Saharan Africa (IDA & IBRD countries)SudanSurinameSwazilandSwedenSwitzerlandSyrian Arab RepublicTajikistanTanzaniaThailandTimor-LesteTogoTrinidad and TobagoTunisiaTurkeyTurkmenistanUgandaUkraineUnited Arab EmiratesUnited KingdomUnited StatesUpper middle incomeUruguayVanuatuVenezuela, RBVietnamWest Bank and GazaWorldZimbabwe Linha do tempo:
Nesta escala de tempo está apresentado um gráfico de 1962 ano até 2016 ano Mexico. Dados de 1961 ano ausente. O número de observações reais por data: 55.
Fonte (nome):
Indicadores de desenvolvimento mundial
Fonte (organização):
World Bank national accounts data, and OECD National Accounts data files.
Categorias:
Economy & Growth
Foi atualizado:
23 abr 2017 ano
Indicadores de alterações dos valores ao longo dos anos
Mínimo:
-3.133
1 jan 2002 ano
Máximo:
34.052
1 jan 1966 ano
Na data de observação
Valor
Mudança absoluta
A alteração em relação ao valor anterior
1 jan 1962 ano
7.504
+7.504
0.0%
1 jan 1963 ano
15.297
+7.792
103.84%
1 jan 1964 ano
12.376
-2.921
-19.09%
1 jan 1965 ano
12.223
-0.153
-1.24%
1 jan 1966 ano
34.052
+21.829
178.58%
1 jan 1967 ano
9.404
-24.648
-72.38%
1 jan 1968 ano
6.603
-2.801
-29.79%
1 jan 1969 ano
9.981
+3.378
51.16%
1 jan 1970 ano
5.659
-4.321
-43.3%
1 jan 1971 ano
9.075
+3.416
60.36%
1 jan 1972 ano
10.454
+1.379
15.2%
1 jan 1973 ano
12.138
+1.683
16.1%
1 jan 1974 ano
9.31
-2.827
-23.29%
1 jan 1975 ano
6.62
-2.69
-28.89%
1 jan 1976 ano
12.666
+6.046
91.32%
1 jan 1977 ano
6.863
-5.803
-45.82%
1 jan 1978 ano
-0.011
-6.874
-100.15%
1 jan 1979 ano
9.446
+9.456
-89.73 mil%
1 jan 1980 ano
9.584
+0.138
1.46%
1 jan 1981 ano
9.545
-0.039
-0.41%
1 jan 1982 ano
10.272
+0.727
7.62%
1 jan 1983 ano
2.029
-8.243
-80.24%
1 jan 1984 ano
2.723
+0.694
34.18%
1 jan 1985 ano
6.587
+3.864
141.91%
1 jan 1986 ano
0.906
-5.681
-86.25%
1 jan 1987 ano
1.48
+0.575
63.43%
1 jan 1988 ano
-1.205
-2.686
-181.43%
1 jan 1989 ano
1.284
+2.489
-206.49%
1 jan 1990 ano
2.197
+0.913
71.15%
1 jan 1991 ano
3.334
+1.138
51.78%
1 jan 1992 ano
5.426
+2.091
62.72%
1 jan 1993 ano
1.859
-3.566
-65.73%
1 jan 1994 ano
11.104
+9.245
497.16%
1 jan 1995 ano
2.257
-8.847
-79.67%
1 jan 1996 ano
0.626
-1.631
-72.25%
1 jan 1997 ano
-0.204
-0.83
-132.49%
1 jan 1998 ano
1.694
+1.898
-932.52%
1 jan 1999 ano
-0.761
-2.455
-144.9%
1 jan 2000 ano
1.757
+2.518
-330.92%
1 jan 2001 ano
2.776
+1.019
58.0%
1 jan 2002 ano
-3.133
-5.909
-212.88%
1 jan 2003 ano
-1.19
+1.943
-62.02%
1 jan 2004 ano
-0.543
+0.647
-54.35%
1 jan 2005 ano
2.388
+2.932
-539.59%
1 jan 2006 ano
3.048
+0.66
27.64%
1 jan 2007 ano
3.398
+0.35
11.48%
1 jan 2008 ano
2.453
-0.945
-27.82%
1 jan 2009 ano
3.035
+0.582
23.72%
1 jan 2010 ano
2.248
-0.786
-25.91%
1 jan 2011 ano
1.711
-0.538
-23.91%
1 jan 2012 ano
2.449
+0.738
43.13%
1 jan 2013 ano
3.481
+1.033
42.17%
1 jan 2014 ano
1.042
-2.439
-70.06%
1 jan 2015 ano
2.141
+1.099
105.49%
1 jan 2016 ano
2.314
+0.173
8.08%
Classificação de países por estatísticas atuais por anos


Comentários: