29
/pt/
pt
AIzaSyAYiBZKx7MnpbEhh9jyipgxe19OcubqV5w
April 1, 2024
223574
Philippines
PHL
true
2
1
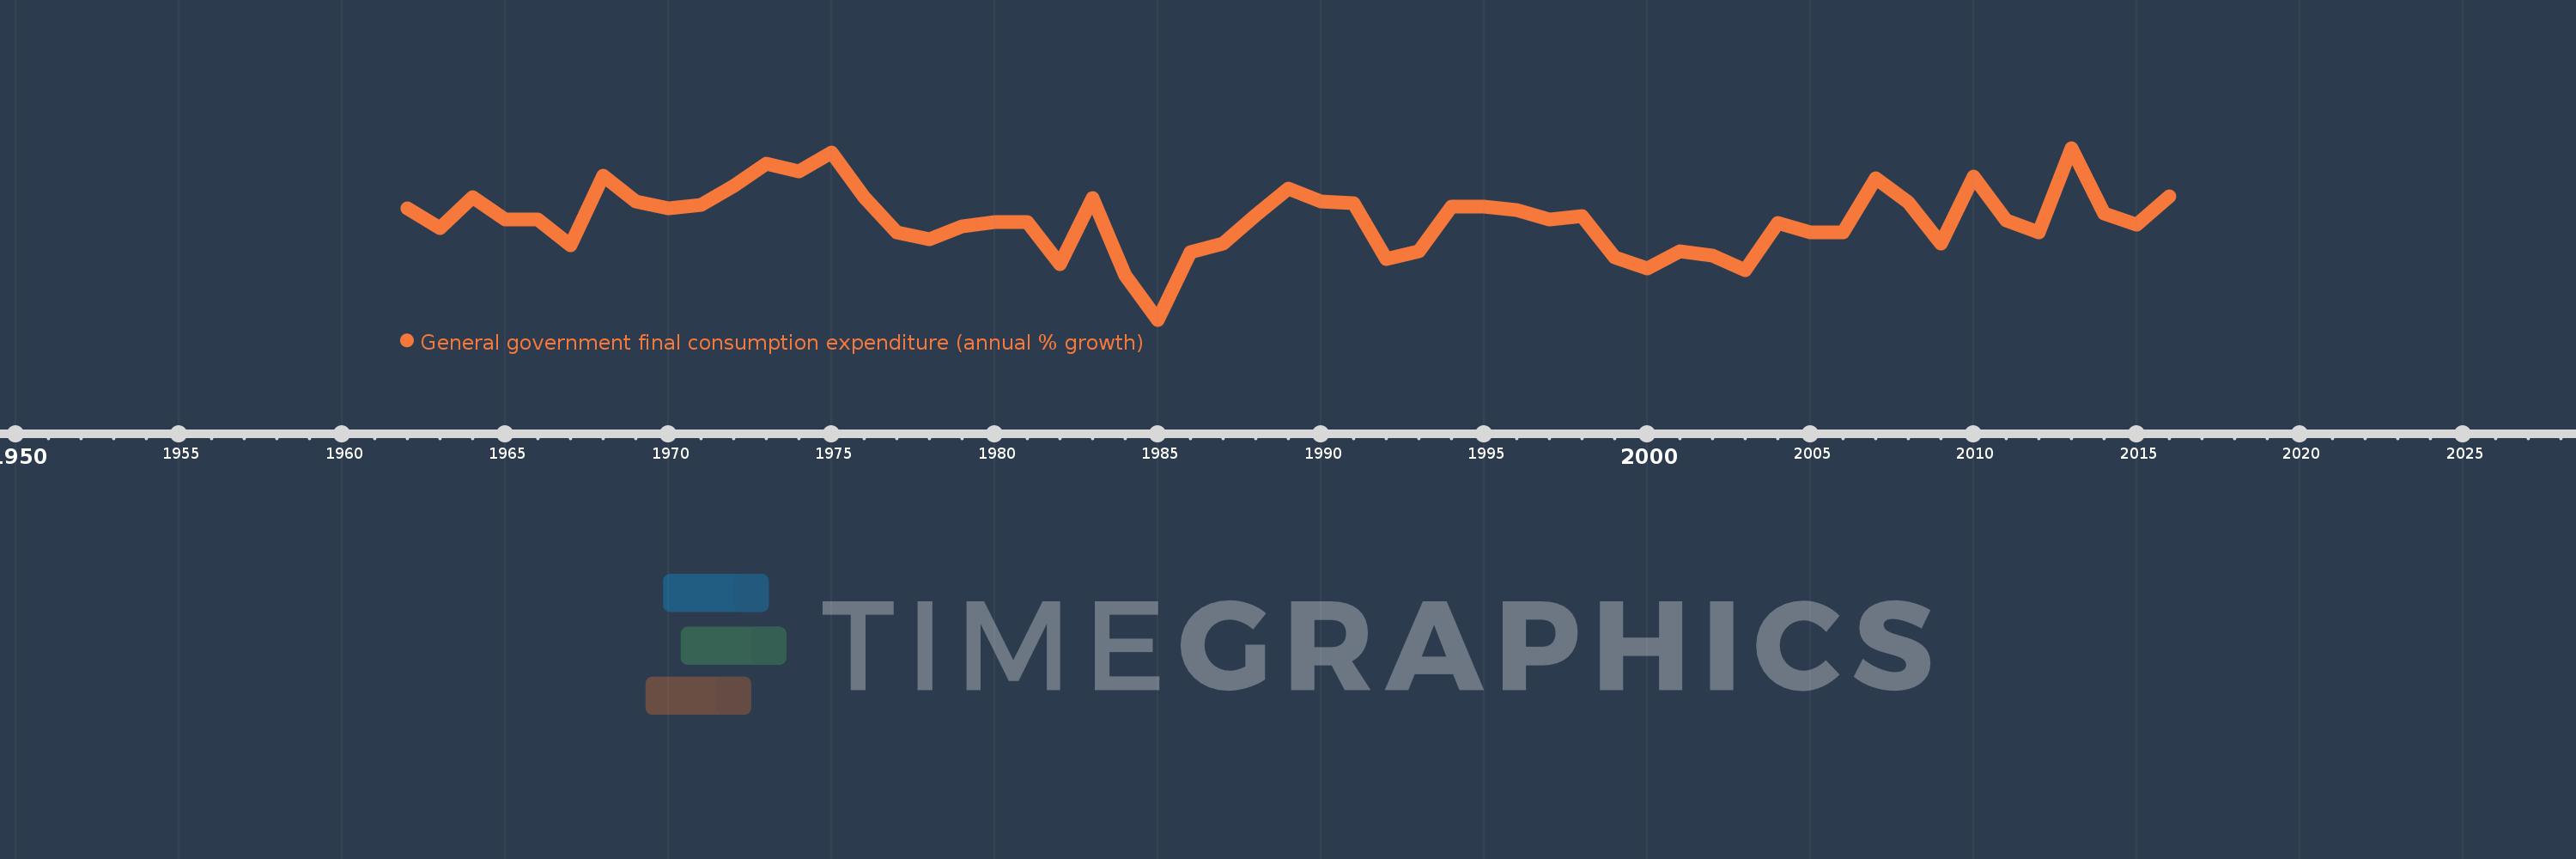
General government final consumption expenditure (annual % growth)
2016,2015,2014,2013,2012,2011,2010,2009,2008,2007,2006,2005,2004,2003,2002,2001,2000,1999,1998,1997,1996,1995,1994,1993,1992,1991,1990,1989,1988,1987,1986,1985,1984,1983,1982,1981,1980,1979,1978,1977,1976,1975,1974,1973,1972,1971,1970,1969,1968,1967,1966,1965,1964,1963,1962
Estas estatísticas em outros países:
AlbaniaAlgeriaAntigua and BarbudaArab WorldArgentinaArmeniaAustraliaAustriaAzerbaijanBahamas, TheBahrainBangladeshBarbadosBelarusBelgiumBelizeBeninBhutanBoliviaBosnia and HerzegovinaBotswanaBrazilBrunei DarussalamBulgariaBurkina FasoBurundiCabo VerdeCambodiaCameroonCanadaCaribbean small statesCentral Europe and the BalticsChadChileChinaColombiaComorosCongo, Dem. Rep.Congo, Rep.Costa RicaCote d'IvoireCroatiaCubaCyprusCzech RepublicDenmarkDjiboutiDominican RepublicEarly-demographic dividendEast Asia & PacificEast Asia & Pacific (excluding high income)East Asia & Pacific (IDA & IBRD countries)EcuadorEgypt, Arab Rep.El SalvadorEquatorial GuineaEritreaEstoniaEthiopiaEuro areaEurope & Central AsiaEurope & Central Asia (excluding high income)Europe & Central Asia (IDA & IBRD countries)European UnionFijiFinlandFranceGabonGambia, TheGeorgiaGermanyGhanaGreeceGuatemalaGuineaGuinea-BissauHaitiHeavily indebted poor countries (HIPC)High incomeHondurasHong Kong SAR, ChinaHungaryIBRD onlyIcelandIDA & IBRD totalIDA blendIDA onlyIDA totalIndiaIndonesiaIran, Islamic Rep.IrelandIsraelItalyJamaicaJapanJordanKazakhstanKenyaKorea, Rep.KosovoKuwaitKyrgyz RepublicLao PDRLate-demographic dividendLatin America & Caribbean Latin America & Caribbean (excluding high income)Latin America & the Caribbean (IDA & IBRD countries)LatviaLebanonLiberiaLithuaniaLow & middle incomeLow incomeLower middle incomeLuxembourgMacao SAR, ChinaMacedonia, FYRMadagascarMalawiMalaysiaMaliMaltaMauritaniaMauritiusMexicoMiddle East & North AfricaMiddle East & North Africa (excluding high income)Middle East & North Africa (IDA & IBRD countries)Middle incomeMoldovaMongoliaMontenegroMoroccoMozambiqueNamibiaNepalNetherlandsNew ZealandNicaraguaNigerNigeriaNorth AmericaNorwayOECD membersOmanOther small statesPakistanPanamaPapua New GuineaParaguayPeruPhilippinesPolandPortugalPost-demographic dividendPuerto RicoQatarRomaniaRussian FederationRwandaSaudi ArabiaSenegalSerbiaSeychellesSierra LeoneSingaporeSlovak RepublicSloveniaSmall statesSomaliaSouth AfricaSouth AsiaSouth Asia (IDA & IBRD)South SudanSpainSri LankaSub-Saharan Africa Sub-Saharan Africa (excluding high income)Sub-Saharan Africa (IDA & IBRD countries)SudanSurinameSwazilandSwedenSwitzerlandSyrian Arab RepublicTajikistanTanzaniaThailandTimor-LesteTogoTrinidad and TobagoTunisiaTurkeyTurkmenistanUgandaUkraineUnited Arab EmiratesUnited KingdomUnited StatesUpper middle incomeUruguayVanuatuVenezuela, RBVietnamWest Bank and GazaWorldZimbabwe Linha do tempo:
Nesta escala de tempo está apresentado um gráfico de 1962 ano até 2016 ano Philippines. Dados de 1961 ano ausente. O número de observações reais por data: 55.
Fonte (nome):
Indicadores de desenvolvimento mundial
Fonte (organização):
World Bank national accounts data, and OECD National Accounts data files.
Categorias:
Economy & Growth
Foi atualizado:
23 abr 2017 ano
Indicadores de alterações dos valores ao longo dos anos
Mínimo:
-11.8
1 jan 1985 ano
Máximo:
15.475
1 jan 2013 ano
Na data de observação
Valor
Mudança absoluta
A alteração em relação ao valor anterior
1 jan 1962 ano
5.896
+5.896
0.0%
1 jan 1963 ano
2.721
-3.175
-53.85%
1 jan 1964 ano
7.668
+4.946
181.76%
1 jan 1965 ano
4.067
-3.601
-46.96%
1 jan 1966 ano
4.18
+0.113
2.77%
1 jan 1967 ano
0.031
-4.149
-99.25%
1 jan 1968 ano
11.105
+11.073
35.37 mil%
1 jan 1969 ano
7.018
-4.086
-36.8%
1 jan 1970 ano
5.944
-1.074
-15.31%
1 jan 1971 ano
6.464
+0.519
8.74%
1 jan 1972 ano
9.482
+3.018
46.7%
1 jan 1973 ano
13.044
+3.562
37.57%
1 jan 1974 ano
11.769
-1.276
-9.78%
1 jan 1975 ano
14.713
+2.944
25.02%
1 jan 1976 ano
7.696
-7.017
-47.69%
1 jan 1977 ano
2.105
-5.591
-72.65%
1 jan 1978 ano
0.932
-1.173
-55.74%
1 jan 1979 ano
3.006
+2.074
222.59%
1 jan 1980 ano
3.696
+0.691
22.98%
1 jan 1981 ano
3.74
+0.044
1.19%
1 jan 1982 ano
-2.993
-6.733
-180.04%
1 jan 1983 ano
7.505
+10.498
-350.71%
1 jan 1984 ano
-4.728
-12.233
-163.0%
1 jan 1985 ano
-11.8
-7.073
149.59%
1 jan 1986 ano
-1.026
+10.775
-91.31%
1 jan 1987 ano
0.342
+1.368
-133.38%
1 jan 1988 ano
4.862
+4.519
1.32 mil%
1 jan 1989 ano
9.065
+4.203
86.46%
1 jan 1990 ano
6.99
-2.075
-22.89%
1 jan 1991 ano
6.752
-0.238
-3.4%
1 jan 1992 ano
-2.132
-8.884
-131.57%
1 jan 1993 ano
-0.876
+1.256
-58.91%
1 jan 1994 ano
6.16
+7.036
-803.3%
1 jan 1995 ano
6.123
-0.037
-0.61%
1 jan 1996 ano
5.561
-0.562
-9.18%
1 jan 1997 ano
4.129
-1.433
-25.76%
1 jan 1998 ano
4.635
+0.506
12.26%
1 jan 1999 ano
-1.95
-6.584
-142.07%
1 jan 2000 ano
-3.631
-1.681
86.21%
1 jan 2001 ano
-0.958
+2.672
-73.6%
1 jan 2002 ano
-1.602
-0.644
67.19%
1 jan 2003 ano
-3.972
-2.37
147.89%
1 jan 2004 ano
3.605
+7.577
-190.76%
1 jan 2005 ano
2.005
-1.6
-44.39%
1 jan 2006 ano
2.057
+0.052
2.6%
1 jan 2007 ano
10.612
+8.555
415.98%
1 jan 2008 ano
6.905
-3.707
-34.94%
1 jan 2009 ano
0.289
-6.616
-95.82%
1 jan 2010 ano
10.908
+10.62
3.68 mil%
1 jan 2011 ano
3.996
-6.912
-63.36%
1 jan 2012 ano
2.085
-1.911
-47.82%
1 jan 2013 ano
15.475
+13.389
642.07%
1 jan 2014 ano
5.004
-10.471
-67.66%
1 jan 2015 ano
3.25
-1.754
-35.04%
1 jan 2016 ano
7.766
+4.516
138.93%
Classificação de países por estatísticas atuais por anos


Comentários: