29
/pt/
pt
AIzaSyAYiBZKx7MnpbEhh9jyipgxe19OcubqV5w
April 1, 2024
255331
Swaziland
SWZ
true
2
1
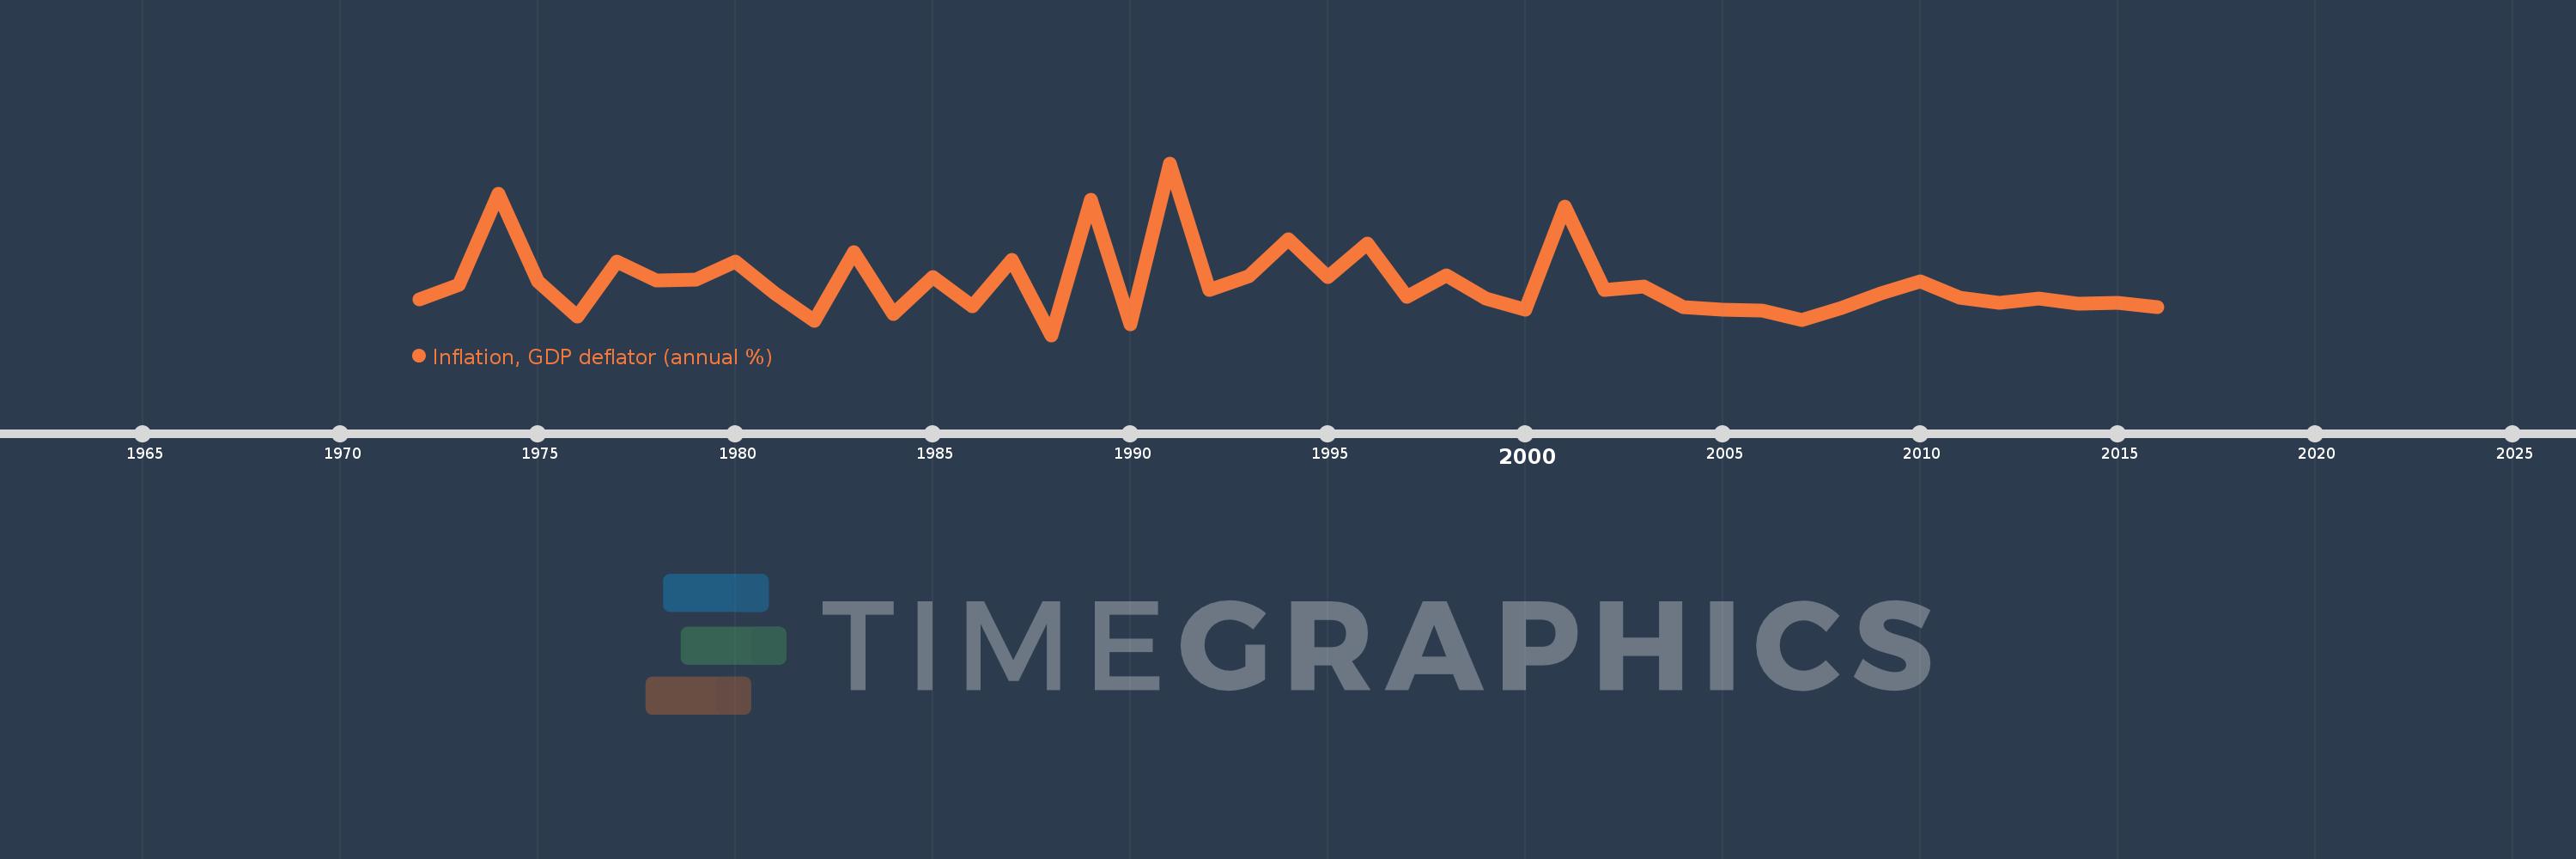
Inflation, GDP deflator (annual %)
2016,2015,2014,2013,2012,2011,2010,2009,2008,2007,2006,2005,2004,2003,2002,2001,2000,1999,1998,1997,1996,1995,1994,1993,1992,1991,1990,1989,1988,1987,1986,1985,1984,1983,1982,1981,1980,1979,1978,1977,1976,1975,1974,1973,1972
Estas estatísticas em outros países:
AfghanistanAlbaniaAlgeriaAndorraAngolaAntigua and BarbudaArab WorldArgentinaArmeniaArubaAustraliaAustriaAzerbaijanBahamas, TheBahrainBangladeshBarbadosBelarusBelgiumBelizeBeninBermudaBhutanBoliviaBosnia and HerzegovinaBotswanaBrazilBrunei DarussalamBulgariaBurkina FasoBurundiCabo VerdeCambodiaCameroonCanadaCaribbean small statesCayman IslandsCentral African RepublicCentral Europe and the BalticsChadChannel IslandsChileChinaColombiaComorosCongo, Dem. Rep.Congo, Rep.Costa RicaCote d'IvoireCroatiaCubaCyprusCzech RepublicDenmarkDjiboutiDominicaDominican RepublicEarly-demographic dividendEast Asia & PacificEast Asia & Pacific (excluding high income)East Asia & Pacific (IDA & IBRD countries)EcuadorEgypt, Arab Rep.El SalvadorEquatorial GuineaEritreaEstoniaEthiopiaEuro areaEurope & Central AsiaEurope & Central Asia (excluding high income)Europe & Central Asia (IDA & IBRD countries)European UnionFijiFinlandFragile and conflict affected situationsFranceFrench PolynesiaGabonGambia, TheGeorgiaGermanyGhanaGreeceGreenlandGrenadaGuatemalaGuineaGuinea-BissauGuyanaHaitiHeavily indebted poor countries (HIPC)High incomeHondurasHong Kong SAR, ChinaHungaryIBRD onlyIcelandIDA & IBRD totalIDA blendIDA onlyIDA totalIndiaIndonesiaIran, Islamic Rep.IraqIrelandIsle of ManIsraelItalyJamaicaJapanJordanKazakhstanKenyaKiribatiKorea, Rep.KosovoKuwaitKyrgyz RepublicLao PDRLate-demographic dividendLatin America & Caribbean Latin America & Caribbean (excluding high income)Latin America & the Caribbean (IDA & IBRD countries)LatviaLeast developed countries: UN classificationLebanonLesothoLiberiaLibyaLiechtensteinLithuaniaLow & middle incomeLow incomeLower middle incomeLuxembourgMacao SAR, ChinaMacedonia, FYRMadagascarMalawiMalaysiaMaldivesMaliMaltaMarshall IslandsMauritaniaMauritiusMexicoMicronesia, Fed. Sts.Middle East & North AfricaMiddle East & North Africa (excluding high income)Middle East & North Africa (IDA & IBRD countries)Middle incomeMoldovaMonacoMongoliaMontenegroMoroccoMozambiqueMyanmarNamibiaNauruNepalNetherlandsNew CaledoniaNew ZealandNicaraguaNigerNigeriaNorth AmericaNorwayOECD membersOmanOther small statesPacific island small statesPakistanPalauPanamaPapua New GuineaParaguayPeruPhilippinesPolandPortugalPost-demographic dividendPre-demographic dividendPuerto RicoQatarRomaniaRussian FederationRwandaSamoaSan MarinoSao Tome and PrincipeSaudi ArabiaSenegalSerbiaSeychellesSierra LeoneSingaporeSlovak RepublicSloveniaSmall statesSolomon IslandsSomaliaSouth AfricaSouth AsiaSouth Asia (IDA & IBRD)South SudanSpainSri LankaSt. Kitts and NevisSt. LuciaSt. Vincent and the GrenadinesSub-Saharan Africa Sub-Saharan Africa (excluding high income)Sub-Saharan Africa (IDA & IBRD countries)SudanSurinameSwazilandSwedenSwitzerlandSyrian Arab RepublicTajikistanTanzaniaThailandTimor-LesteTogoTongaTrinidad and TobagoTunisiaTurkeyTurkmenistanTuvaluUgandaUkraineUnited Arab EmiratesUnited KingdomUnited StatesUpper middle incomeUruguayUzbekistanVanuatuVenezuela, RBVietnamVirgin Islands (U.S.)West Bank and GazaWorldYemen, Rep.ZambiaZimbabwe Linha do tempo:
Nesta escala de tempo está apresentado um gráfico de 1972 ano até 2016 ano Swaziland. Dados de 1971 ano ausente. O número de observações reais por data: 45.
Fonte (nome):
Indicadores de desenvolvimento mundial
Fonte (organização):
World Bank national accounts data, and OECD National Accounts data files.
Categorias:
Economy & Growth
Foi atualizado:
23 abr 2017 ano
Indicadores de alterações dos valores ao longo dos anos
Mínimo:
1.113
1 jan 1988 ano
Máximo:
30.385
1 jan 1991 ano
Na data de observação
Valor
Mudança absoluta
A alteração em relação ao valor anterior
1 jan 1972 ano
7.125
+7.125
0.0%
1 jan 1973 ano
9.627
+2.502
35.12%
1 jan 1974 ano
25.231
+15.603
162.08%
1 jan 1975 ano
10.289
-14.942
-59.22%
1 jan 1976 ano
4.214
-6.075
-59.05%
1 jan 1977 ano
13.57
+9.357
222.05%
1 jan 1978 ano
10.446
-3.124
-23.02%
1 jan 1979 ano
10.56
+0.114
1.09%
1 jan 1980 ano
13.588
+3.028
28.67%
1 jan 1981 ano
8.21
-5.378
-39.58%
1 jan 1982 ano
3.51
-4.699
-57.24%
1 jan 1983 ano
15.18
+11.669
332.43%
1 jan 1984 ano
4.737
-10.443
-68.79%
1 jan 1985 ano
11.065
+6.328
133.59%
1 jan 1986 ano
5.987
-5.078
-45.89%
1 jan 1987 ano
13.917
+7.929
132.43%
1 jan 1988 ano
1.113
-12.803
-92.0%
1 jan 1989 ano
24.133
+23.019
2.07 mil%
1 jan 1990 ano
2.892
-21.241
-88.02%
1 jan 1991 ano
30.385
+27.493
950.75%
1 jan 1992 ano
8.778
-21.607
-71.11%
1 jan 1993 ano
11.188
+2.41
27.46%
1 jan 1994 ano
17.39
+6.202
55.43%
1 jan 1995 ano
10.97
-6.419
-36.91%
1 jan 1996 ano
16.649
+5.679
51.77%
1 jan 1997 ano
7.682
-8.967
-53.86%
1 jan 1998 ano
11.345
+3.662
47.67%
1 jan 1999 ano
7.405
-3.94
-34.73%
1 jan 2000 ano
5.37
-2.035
-27.48%
1 jan 2001 ano
22.96
+17.59
327.56%
1 jan 2002 ano
8.844
-14.117
-61.48%
1 jan 2003 ano
9.422
+0.579
6.54%
1 jan 2004 ano
5.924
-3.499
-37.13%
1 jan 2005 ano
5.377
-0.546
-9.22%
1 jan 2006 ano
5.276
-0.101
-1.87%
1 jan 2007 ano
3.725
-1.552
-29.41%
1 jan 2008 ano
5.727
+2.003
53.77%
1 jan 2009 ano
8.221
+2.493
43.54%
1 jan 2010 ano
10.331
+2.111
25.68%
1 jan 2011 ano
7.436
-2.895
-28.02%
1 jan 2012 ano
6.651
-0.785
-10.55%
1 jan 2013 ano
7.303
+0.652
9.8%
1 jan 2014 ano
6.51
-0.793
-10.86%
1 jan 2015 ano
6.588
+0.077
1.19%
1 jan 2016 ano
5.8
-0.788
-11.96%
Classificação de países por estatísticas atuais por anos


Comentários: