29
/pt/
pt
AIzaSyAYiBZKx7MnpbEhh9jyipgxe19OcubqV5w
April 1, 2024
191538
Malta
MLT
true
2
1
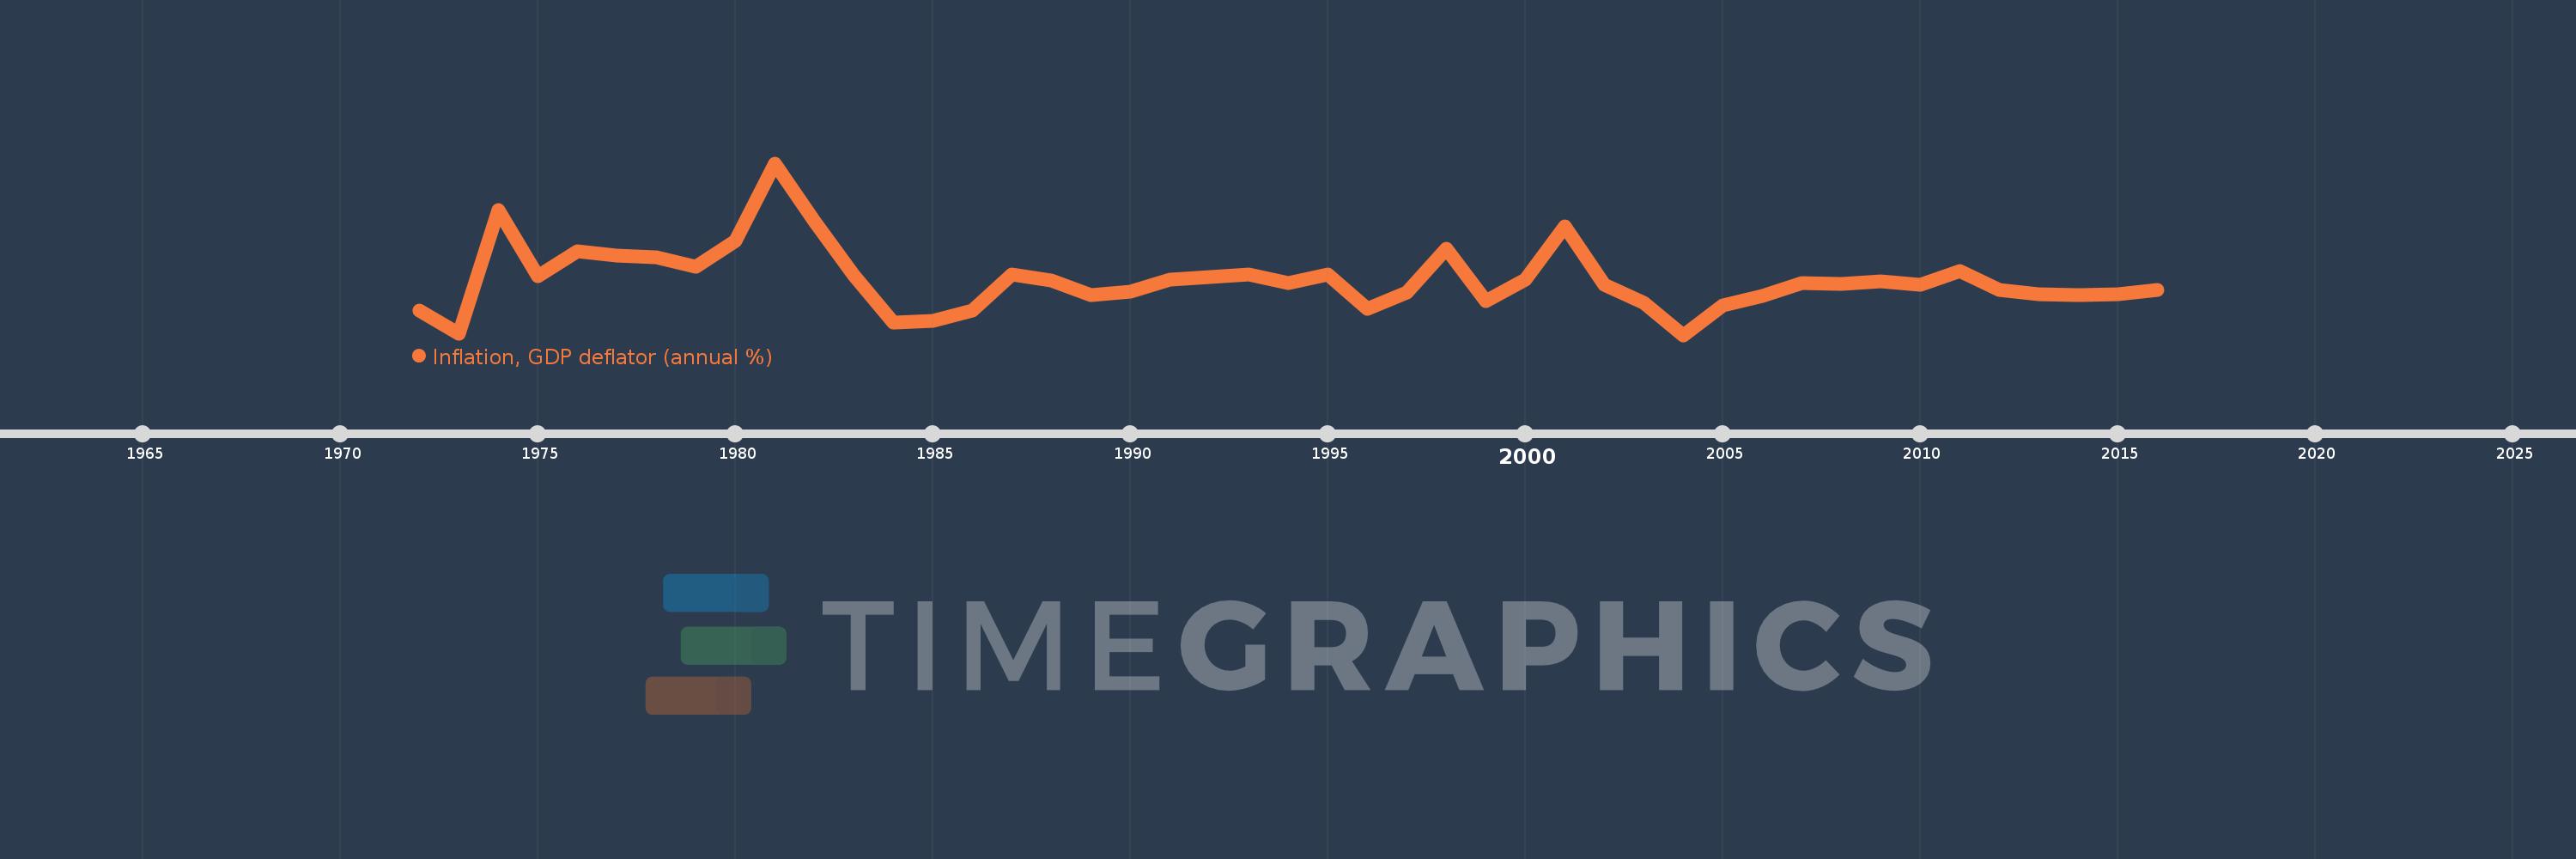
Inflation, GDP deflator (annual %)
2016,2015,2014,2013,2012,2011,2010,2009,2008,2007,2006,2005,2004,2003,2002,2001,2000,1999,1998,1997,1996,1995,1994,1993,1992,1991,1990,1989,1988,1987,1986,1985,1984,1983,1982,1981,1980,1979,1978,1977,1976,1975,1974,1973,1972
Estas estatísticas em outros países:
AfghanistanAlbaniaAlgeriaAndorraAngolaAntigua and BarbudaArab WorldArgentinaArmeniaArubaAustraliaAustriaAzerbaijanBahamas, TheBahrainBangladeshBarbadosBelarusBelgiumBelizeBeninBermudaBhutanBoliviaBosnia and HerzegovinaBotswanaBrazilBrunei DarussalamBulgariaBurkina FasoBurundiCabo VerdeCambodiaCameroonCanadaCaribbean small statesCayman IslandsCentral African RepublicCentral Europe and the BalticsChadChannel IslandsChileChinaColombiaComorosCongo, Dem. Rep.Congo, Rep.Costa RicaCote d'IvoireCroatiaCubaCyprusCzech RepublicDenmarkDjiboutiDominicaDominican RepublicEarly-demographic dividendEast Asia & PacificEast Asia & Pacific (excluding high income)East Asia & Pacific (IDA & IBRD countries)EcuadorEgypt, Arab Rep.El SalvadorEquatorial GuineaEritreaEstoniaEthiopiaEuro areaEurope & Central AsiaEurope & Central Asia (excluding high income)Europe & Central Asia (IDA & IBRD countries)European UnionFijiFinlandFragile and conflict affected situationsFranceFrench PolynesiaGabonGambia, TheGeorgiaGermanyGhanaGreeceGreenlandGrenadaGuatemalaGuineaGuinea-BissauGuyanaHaitiHeavily indebted poor countries (HIPC)High incomeHondurasHong Kong SAR, ChinaHungaryIBRD onlyIcelandIDA & IBRD totalIDA blendIDA onlyIDA totalIndiaIndonesiaIran, Islamic Rep.IraqIrelandIsle of ManIsraelItalyJamaicaJapanJordanKazakhstanKenyaKiribatiKorea, Rep.KosovoKuwaitKyrgyz RepublicLao PDRLate-demographic dividendLatin America & Caribbean Latin America & Caribbean (excluding high income)Latin America & the Caribbean (IDA & IBRD countries)LatviaLeast developed countries: UN classificationLebanonLesothoLiberiaLibyaLiechtensteinLithuaniaLow & middle incomeLow incomeLower middle incomeLuxembourgMacao SAR, ChinaMacedonia, FYRMadagascarMalawiMalaysiaMaldivesMaliMaltaMarshall IslandsMauritaniaMauritiusMexicoMicronesia, Fed. Sts.Middle East & North AfricaMiddle East & North Africa (excluding high income)Middle East & North Africa (IDA & IBRD countries)Middle incomeMoldovaMonacoMongoliaMontenegroMoroccoMozambiqueMyanmarNamibiaNauruNepalNetherlandsNew CaledoniaNew ZealandNicaraguaNigerNigeriaNorth AmericaNorwayOECD membersOmanOther small statesPacific island small statesPakistanPalauPanamaPapua New GuineaParaguayPeruPhilippinesPolandPortugalPost-demographic dividendPre-demographic dividendPuerto RicoQatarRomaniaRussian FederationRwandaSamoaSan MarinoSao Tome and PrincipeSaudi ArabiaSenegalSerbiaSeychellesSierra LeoneSingaporeSlovak RepublicSloveniaSmall statesSolomon IslandsSomaliaSouth AfricaSouth AsiaSouth Asia (IDA & IBRD)South SudanSpainSri LankaSt. Kitts and NevisSt. LuciaSt. Vincent and the GrenadinesSub-Saharan Africa Sub-Saharan Africa (excluding high income)Sub-Saharan Africa (IDA & IBRD countries)SudanSurinameSwazilandSwedenSwitzerlandSyrian Arab RepublicTajikistanTanzaniaThailandTimor-LesteTogoTongaTrinidad and TobagoTunisiaTurkeyTurkmenistanTuvaluUgandaUkraineUnited Arab EmiratesUnited KingdomUnited StatesUpper middle incomeUruguayUzbekistanVanuatuVenezuela, RBVietnamVirgin Islands (U.S.)West Bank and GazaWorldYemen, Rep.ZambiaZimbabwe Linha do tempo:
Nesta escala de tempo está apresentado um gráfico de 1972 ano até 2016 ano Malta. Dados de 1971 ano ausente. O número de observações reais por data: 45.
Fonte (nome):
Indicadores de desenvolvimento mundial
Fonte (organização):
World Bank national accounts data, and OECD National Accounts data files.
Categorias:
Economy & Growth
Foi atualizado:
23 abr 2017 ano
Indicadores de alterações dos valores ao longo dos anos
Mínimo:
-1.297
1 jan 2004 ano
Máximo:
12.393
1 jan 1981 ano
Na data de observação
Valor
Mudança absoluta
A alteração em relação ao valor anterior
1 jan 1972 ano
0.633
+0.633
0.0%
1 jan 1973 ano
-1.223
-1.856
-293.19%
1 jan 1974 ano
8.687
+9.91
-810.12%
1 jan 1975 ano
3.364
-5.323
-61.28%
1 jan 1976 ano
5.363
+2.0
59.44%
1 jan 1977 ano
5.027
-0.337
-6.27%
1 jan 1978 ano
4.921
-0.106
-2.11%
1 jan 1979 ano
4.155
-0.766
-15.56%
1 jan 1980 ano
6.206
+2.051
49.37%
1 jan 1981 ano
12.393
+6.186
99.67%
1 jan 1982 ano
7.78
-4.612
-37.22%
1 jan 1983 ano
3.442
-4.339
-55.76%
1 jan 1984 ano
-0.305
-3.747
-108.88%
1 jan 1985 ano
-0.177
+0.129
-42.17%
1 jan 1986 ano
0.637
+0.813
-460.33%
1 jan 1987 ano
3.518
+2.881
452.65%
1 jan 1988 ano
3.051
-0.466
-13.25%
1 jan 1989 ano
1.86
-1.192
-39.06%
1 jan 1990 ano
2.147
+0.287
15.46%
1 jan 1991 ano
3.151
+1.004
46.76%
1 jan 1992 ano
3.351
+0.2
6.34%
1 jan 1993 ano
3.554
+0.204
6.07%
1 jan 1994 ano
2.855
-0.7
-19.69%
1 jan 1995 ano
3.562
+0.707
24.78%
1 jan 1996 ano
0.782
-2.78
-78.06%
1 jan 1997 ano
2.103
+1.321
169.06%
1 jan 1998 ano
5.588
+3.485
165.73%
1 jan 1999 ano
1.377
-4.211
-75.35%
1 jan 2000 ano
3.147
+1.77
128.49%
1 jan 2001 ano
7.33
+4.183
132.91%
1 jan 2002 ano
2.702
-4.628
-63.14%
1 jan 2003 ano
1.297
-1.405
-52.0%
1 jan 2004 ano
-1.297
-2.594
-200.01%
1 jan 2005 ano
1.064
+2.361
-182.03%
1 jan 2006 ano
1.796
+0.732
68.84%
1 jan 2007 ano
2.864
+1.068
59.43%
1 jan 2008 ano
2.798
-0.066
-2.32%
1 jan 2009 ano
3.0
+0.203
7.25%
1 jan 2010 ano
2.69
-0.31
-10.34%
1 jan 2011 ano
3.83
+1.14
42.37%
1 jan 2012 ano
2.308
-1.522
-39.73%
1 jan 2013 ano
1.95
-0.358
-15.52%
1 jan 2014 ano
1.86
-0.09
-4.6%
1 jan 2015 ano
1.967
+0.107
5.73%
1 jan 2016 ano
2.298
+0.331
16.82%
Classificação de países por estatísticas atuais por anos


Comentários: