29
/pt/
pt
AIzaSyAYiBZKx7MnpbEhh9jyipgxe19OcubqV5w
April 1, 2024
226046
Portugal
PRT
true
2
1
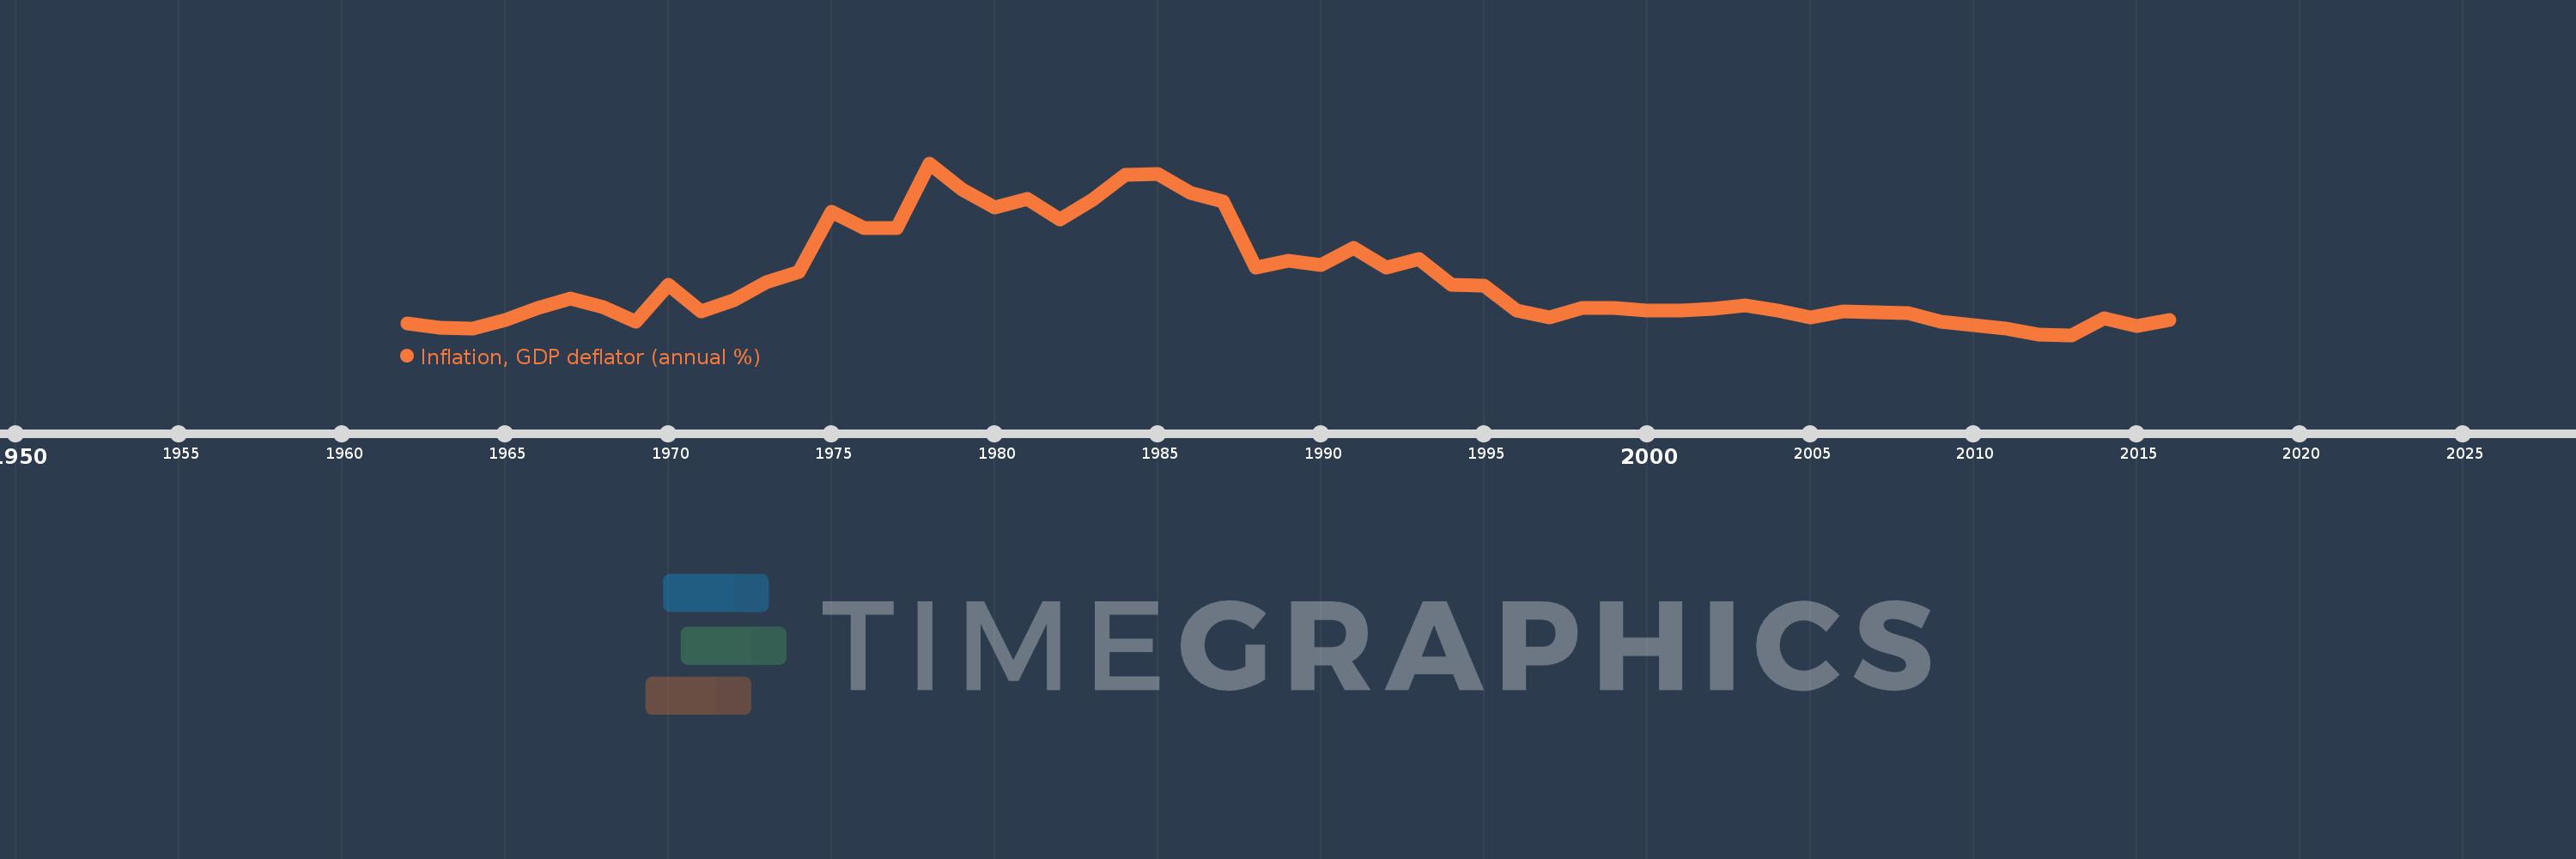
Inflation, GDP deflator (annual %)
2016,2015,2014,2013,2012,2011,2010,2009,2008,2007,2006,2005,2004,2003,2002,2001,2000,1999,1998,1997,1996,1995,1994,1993,1992,1991,1990,1989,1988,1987,1986,1985,1984,1983,1982,1981,1980,1979,1978,1977,1976,1975,1974,1973,1972,1971,1970,1969,1968,1967,1966,1965,1964,1963,1962
Estas estatísticas em outros países:
AfghanistanAlbaniaAlgeriaAndorraAngolaAntigua and BarbudaArab WorldArgentinaArmeniaArubaAustraliaAustriaAzerbaijanBahamas, TheBahrainBangladeshBarbadosBelarusBelgiumBelizeBeninBermudaBhutanBoliviaBosnia and HerzegovinaBotswanaBrazilBrunei DarussalamBulgariaBurkina FasoBurundiCabo VerdeCambodiaCameroonCanadaCaribbean small statesCayman IslandsCentral African RepublicCentral Europe and the BalticsChadChannel IslandsChileChinaColombiaComorosCongo, Dem. Rep.Congo, Rep.Costa RicaCote d'IvoireCroatiaCubaCyprusCzech RepublicDenmarkDjiboutiDominicaDominican RepublicEarly-demographic dividendEast Asia & PacificEast Asia & Pacific (excluding high income)East Asia & Pacific (IDA & IBRD countries)EcuadorEgypt, Arab Rep.El SalvadorEquatorial GuineaEritreaEstoniaEthiopiaEuro areaEurope & Central AsiaEurope & Central Asia (excluding high income)Europe & Central Asia (IDA & IBRD countries)European UnionFijiFinlandFragile and conflict affected situationsFranceFrench PolynesiaGabonGambia, TheGeorgiaGermanyGhanaGreeceGreenlandGrenadaGuatemalaGuineaGuinea-BissauGuyanaHaitiHeavily indebted poor countries (HIPC)High incomeHondurasHong Kong SAR, ChinaHungaryIBRD onlyIcelandIDA & IBRD totalIDA blendIDA onlyIDA totalIndiaIndonesiaIran, Islamic Rep.IraqIrelandIsle of ManIsraelItalyJamaicaJapanJordanKazakhstanKenyaKiribatiKorea, Rep.KosovoKuwaitKyrgyz RepublicLao PDRLate-demographic dividendLatin America & Caribbean Latin America & Caribbean (excluding high income)Latin America & the Caribbean (IDA & IBRD countries)LatviaLeast developed countries: UN classificationLebanonLesothoLiberiaLibyaLiechtensteinLithuaniaLow & middle incomeLow incomeLower middle incomeLuxembourgMacao SAR, ChinaMacedonia, FYRMadagascarMalawiMalaysiaMaldivesMaliMaltaMarshall IslandsMauritaniaMauritiusMexicoMicronesia, Fed. Sts.Middle East & North AfricaMiddle East & North Africa (excluding high income)Middle East & North Africa (IDA & IBRD countries)Middle incomeMoldovaMonacoMongoliaMontenegroMoroccoMozambiqueMyanmarNamibiaNauruNepalNetherlandsNew CaledoniaNew ZealandNicaraguaNigerNigeriaNorth AmericaNorwayOECD membersOmanOther small statesPacific island small statesPakistanPalauPanamaPapua New GuineaParaguayPeruPhilippinesPolandPortugalPost-demographic dividendPre-demographic dividendPuerto RicoQatarRomaniaRussian FederationRwandaSamoaSan MarinoSao Tome and PrincipeSaudi ArabiaSenegalSerbiaSeychellesSierra LeoneSingaporeSlovak RepublicSloveniaSmall statesSolomon IslandsSomaliaSouth AfricaSouth AsiaSouth Asia (IDA & IBRD)South SudanSpainSri LankaSt. Kitts and NevisSt. LuciaSt. Vincent and the GrenadinesSub-Saharan Africa Sub-Saharan Africa (excluding high income)Sub-Saharan Africa (IDA & IBRD countries)SudanSurinameSwazilandSwedenSwitzerlandSyrian Arab RepublicTajikistanTanzaniaThailandTimor-LesteTogoTongaTrinidad and TobagoTunisiaTurkeyTurkmenistanTuvaluUgandaUkraineUnited Arab EmiratesUnited KingdomUnited StatesUpper middle incomeUruguayUzbekistanVanuatuVenezuela, RBVietnamVirgin Islands (U.S.)West Bank and GazaWorldYemen, Rep.ZambiaZimbabwe Linha do tempo:
Nesta escala de tempo está apresentado um gráfico de 1962 ano até 2016 ano Portugal. Dados de 1961 ano ausente. O número de observações reais por data: 55.
Fonte (nome):
Indicadores de desenvolvimento mundial
Fonte (organização):
World Bank national accounts data, and OECD National Accounts data files.
Categorias:
Economy & Growth
Foi atualizado:
23 abr 2017 ano
Indicadores de alterações dos valores ao longo dos anos
Mínimo:
-0.398
1 jan 2013 ano
Máximo:
26.4
1 jan 1978 ano
Na data de observação
Valor
Mudança absoluta
A alteração em relação ao valor anterior
1 jan 1962 ano
1.412
+1.412
0.0%
1 jan 1963 ano
0.677
-0.735
-52.07%
1 jan 1964 ano
0.568
-0.109
-16.09%
1 jan 1965 ano
2.008
+1.441
253.71%
1 jan 1966 ano
3.872
+1.864
92.8%
1 jan 1967 ano
5.263
+1.391
35.93%
1 jan 1968 ano
3.937
-1.327
-25.2%
1 jan 1969 ano
1.673
-2.264
-57.51%
1 jan 1970 ano
7.397
+5.724
342.2%
1 jan 1971 ano
3.323
-4.074
-55.08%
1 jan 1972 ano
5.017
+1.694
50.97%
1 jan 1973 ano
7.805
+2.788
55.57%
1 jan 1974 ano
9.466
+1.662
21.29%
1 jan 1975 ano
18.865
+9.399
99.29%
1 jan 1976 ano
16.23
-2.635
-13.97%
1 jan 1977 ano
16.274
+0.044
0.27%
1 jan 1978 ano
26.4
+10.126
62.22%
1 jan 1979 ano
22.348
-4.052
-15.35%
1 jan 1980 ano
19.437
-2.911
-13.02%
1 jan 1981 ano
20.903
+1.466
7.54%
1 jan 1982 ano
17.609
-3.294
-15.76%
1 jan 1983 ano
20.69
+3.081
17.5%
1 jan 1984 ano
24.605
+3.915
18.92%
1 jan 1985 ano
24.676
+0.07
0.29%
1 jan 1986 ano
21.735
-2.941
-11.92%
1 jan 1987 ano
20.451
-1.283
-5.9%
1 jan 1988 ano
10.097
-10.354
-50.63%
1 jan 1989 ano
11.165
+1.069
10.58%
1 jan 1990 ano
10.514
-0.652
-5.84%
1 jan 1991 ano
13.145
+2.631
25.02%
1 jan 1992 ano
10.086
-3.058
-23.27%
1 jan 1993 ano
11.446
+1.36
13.48%
1 jan 1994 ano
7.376
-4.07
-35.55%
1 jan 1995 ano
7.278
-0.099
-1.34%
1 jan 1996 ano
3.429
-3.849
-52.89%
1 jan 1997 ano
2.388
-1.04
-30.35%
1 jan 1998 ano
3.887
+1.498
62.74%
1 jan 1999 ano
3.844
-0.042
-1.08%
1 jan 2000 ano
3.39
-0.454
-11.81%
1 jan 2001 ano
3.46
+0.069
2.05%
1 jan 2002 ano
3.715
+0.255
7.37%
1 jan 2003 ano
4.208
+0.493
13.28%
1 jan 2004 ano
3.439
-0.769
-18.27%
1 jan 2005 ano
2.396
-1.043
-30.33%
1 jan 2006 ano
3.33
+0.934
38.97%
1 jan 2007 ano
3.185
-0.144
-4.34%
1 jan 2008 ano
2.979
-0.206
-6.48%
1 jan 2009 ano
1.738
-1.241
-41.67%
1 jan 2010 ano
1.096
-0.641
-36.91%
1 jan 2011 ano
0.643
-0.453
-41.31%
1 jan 2012 ano
-0.27
-0.913
-141.89%
1 jan 2013 ano
-0.398
-0.128
47.48%
1 jan 2014 ano
2.267
+2.665
-670.23%
1 jan 2015 ano
0.951
-1.316
-58.03%
1 jan 2016 ano
1.937
+0.985
103.55%
Classificação de países por estatísticas atuais por anos


Comentários: