29
/pt/
pt
AIzaSyAYiBZKx7MnpbEhh9jyipgxe19OcubqV5w
April 1, 2024
254263
Suriname
SUR
true
2
1
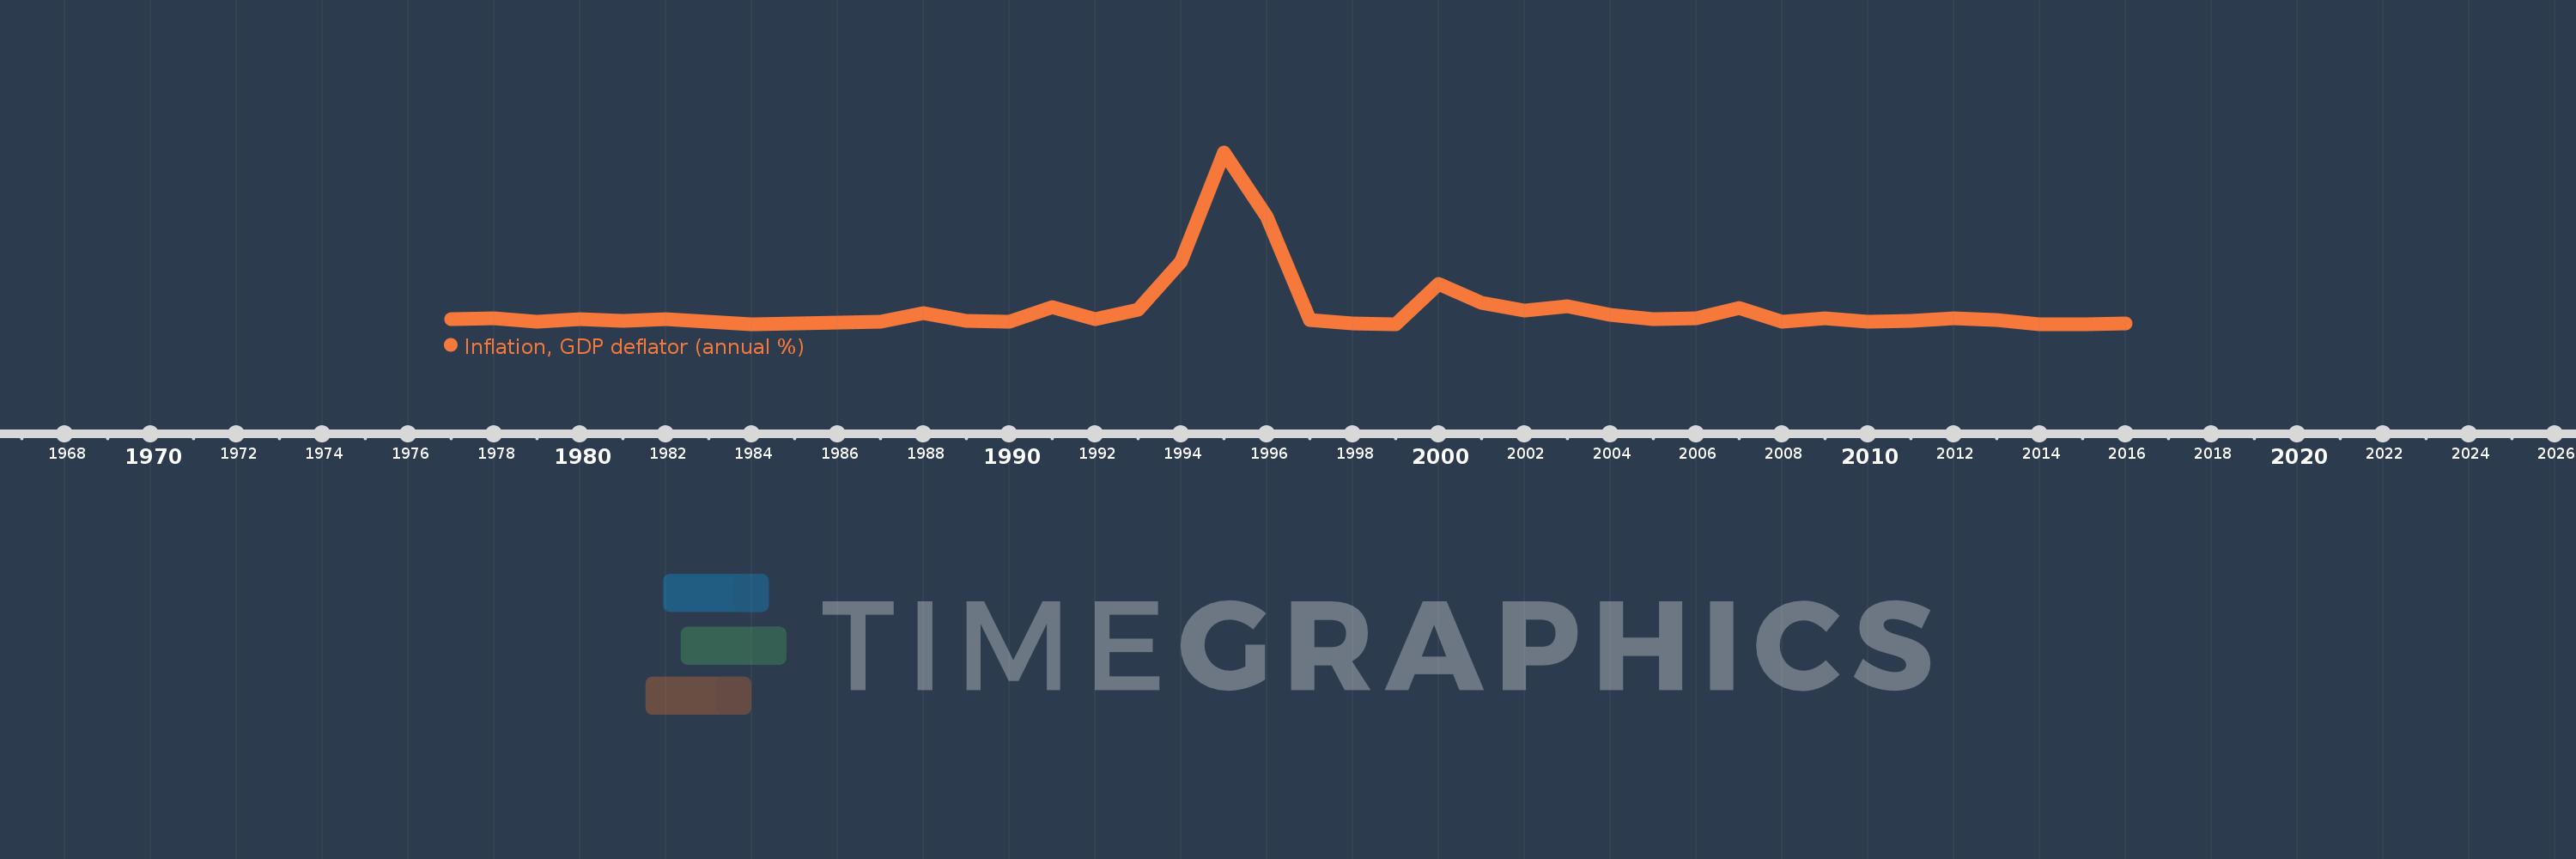
Inflation, GDP deflator (annual %)
2016,2015,2014,2013,2012,2011,2010,2009,2008,2007,2006,2005,2004,2003,2002,2001,2000,1999,1998,1997,1996,1995,1994,1993,1992,1991,1990,1989,1988,1987,1986,1985,1984,1983,1982,1981,1980,1979,1978,1977
Estas estatísticas em outros países:
AfghanistanAlbaniaAlgeriaAndorraAngolaAntigua and BarbudaArab WorldArgentinaArmeniaArubaAustraliaAustriaAzerbaijanBahamas, TheBahrainBangladeshBarbadosBelarusBelgiumBelizeBeninBermudaBhutanBoliviaBosnia and HerzegovinaBotswanaBrazilBrunei DarussalamBulgariaBurkina FasoBurundiCabo VerdeCambodiaCameroonCanadaCaribbean small statesCayman IslandsCentral African RepublicCentral Europe and the BalticsChadChannel IslandsChileChinaColombiaComorosCongo, Dem. Rep.Congo, Rep.Costa RicaCote d'IvoireCroatiaCubaCyprusCzech RepublicDenmarkDjiboutiDominicaDominican RepublicEarly-demographic dividendEast Asia & PacificEast Asia & Pacific (excluding high income)East Asia & Pacific (IDA & IBRD countries)EcuadorEgypt, Arab Rep.El SalvadorEquatorial GuineaEritreaEstoniaEthiopiaEuro areaEurope & Central AsiaEurope & Central Asia (excluding high income)Europe & Central Asia (IDA & IBRD countries)European UnionFijiFinlandFragile and conflict affected situationsFranceFrench PolynesiaGabonGambia, TheGeorgiaGermanyGhanaGreeceGreenlandGrenadaGuatemalaGuineaGuinea-BissauGuyanaHaitiHeavily indebted poor countries (HIPC)High incomeHondurasHong Kong SAR, ChinaHungaryIBRD onlyIcelandIDA & IBRD totalIDA blendIDA onlyIDA totalIndiaIndonesiaIran, Islamic Rep.IraqIrelandIsle of ManIsraelItalyJamaicaJapanJordanKazakhstanKenyaKiribatiKorea, Rep.KosovoKuwaitKyrgyz RepublicLao PDRLate-demographic dividendLatin America & Caribbean Latin America & Caribbean (excluding high income)Latin America & the Caribbean (IDA & IBRD countries)LatviaLeast developed countries: UN classificationLebanonLesothoLiberiaLibyaLiechtensteinLithuaniaLow & middle incomeLow incomeLower middle incomeLuxembourgMacao SAR, ChinaMacedonia, FYRMadagascarMalawiMalaysiaMaldivesMaliMaltaMarshall IslandsMauritaniaMauritiusMexicoMicronesia, Fed. Sts.Middle East & North AfricaMiddle East & North Africa (excluding high income)Middle East & North Africa (IDA & IBRD countries)Middle incomeMoldovaMonacoMongoliaMontenegroMoroccoMozambiqueMyanmarNamibiaNauruNepalNetherlandsNew CaledoniaNew ZealandNicaraguaNigerNigeriaNorth AmericaNorwayOECD membersOmanOther small statesPacific island small statesPakistanPalauPanamaPapua New GuineaParaguayPeruPhilippinesPolandPortugalPost-demographic dividendPre-demographic dividendPuerto RicoQatarRomaniaRussian FederationRwandaSamoaSan MarinoSao Tome and PrincipeSaudi ArabiaSenegalSerbiaSeychellesSierra LeoneSingaporeSlovak RepublicSloveniaSmall statesSolomon IslandsSomaliaSouth AfricaSouth AsiaSouth Asia (IDA & IBRD)South SudanSpainSri LankaSt. Kitts and NevisSt. LuciaSt. Vincent and the GrenadinesSub-Saharan Africa Sub-Saharan Africa (excluding high income)Sub-Saharan Africa (IDA & IBRD countries)SudanSurinameSwazilandSwedenSwitzerlandSyrian Arab RepublicTajikistanTanzaniaThailandTimor-LesteTogoTongaTrinidad and TobagoTunisiaTurkeyTurkmenistanTuvaluUgandaUkraineUnited Arab EmiratesUnited KingdomUnited StatesUpper middle incomeUruguayUzbekistanVanuatuVenezuela, RBVietnamVirgin Islands (U.S.)West Bank and GazaWorldYemen, Rep.ZambiaZimbabwe Linha do tempo:
Nesta escala de tempo está apresentado um gráfico de 1977 ano até 2016 ano Suriname. Dados de 1976 ano ausente. O número de observações reais por data: 40.
Fonte (nome):
Indicadores de desenvolvimento mundial
Fonte (organização):
World Bank national accounts data, and OECD National Accounts data files.
Categorias:
Economy & Growth
Foi atualizado:
23 abr 2017 ano
Indicadores de alterações dos valores ao longo dos anos
Mínimo:
-0.418
1 jan 1984 ano
Máximo:
439.023
1 jan 1995 ano
Na data de observação
Valor
Mudança absoluta
A alteração em relação ao valor anterior
1 jan 1977 ano
12.737
+12.737
0.0%
1 jan 1978 ano
15.182
+2.445
19.2%
1 jan 1979 ano
6.625
-8.557
-56.36%
1 jan 1980 ano
13.286
+6.661
100.54%
1 jan 1981 ano
7.091
-6.195
-46.63%
1 jan 1982 ano
11.56
+4.469
63.03%
1 jan 1983 ano
5.055
-6.505
-56.27%
1 jan 1984 ano
-0.418
-5.473
-108.27%
1 jan 1985 ano
1.772
+2.19
-524.18%
1 jan 1986 ano
2.966
+1.194
67.36%
1 jan 1987 ano
5.783
+2.817
94.97%
1 jan 1988 ano
28.118
+22.335
386.21%
1 jan 1989 ano
8.922
-19.196
-68.27%
1 jan 1990 ano
5.236
-3.686
-41.31%
1 jan 1991 ano
43.85
+38.613
737.42%
1 jan 1992 ano
12.327
-31.523
-71.89%
1 jan 1993 ano
35.651
+23.324
189.22%
1 jan 1994 ano
159.011
+123.36
346.02%
1 jan 1995 ano
439.023
+280.012
176.1%
1 jan 1996 ano
273.95
-165.073
-37.6%
1 jan 1997 ano
11.096
-262.854
-95.95%
1 jan 1998 ano
1.9
-9.196
-82.88%
1 jan 1999 ano
0.09
-1.81
-95.25%
1 jan 2000 ano
103.22
+103.13
114.34 mil%
1 jan 2001 ano
54.76
-48.461
-46.95%
1 jan 2002 ano
35.173
-19.586
-35.77%
1 jan 2003 ano
45.988
+10.815
30.75%
1 jan 2004 ano
23.071
-22.917
-49.83%
1 jan 2005 ano
12.321
-10.75
-46.6%
1 jan 2006 ano
15.485
+3.164
25.68%
1 jan 2007 ano
41.62
+26.135
168.77%
1 jan 2008 ano
6.425
-35.195
-84.56%
1 jan 2009 ano
15.521
+9.096
141.57%
1 jan 2010 ano
6.484
-9.038
-58.23%
1 jan 2011 ano
7.208
+0.725
11.18%
1 jan 2012 ano
14.474
+7.266
100.8%
1 jan 2013 ano
10.326
-4.148
-28.66%
1 jan 2014 ano
0.187
-10.139
-98.19%
1 jan 2015 ano
-0.29
-0.477
-254.98%
1 jan 2016 ano
2.652
+2.942
-1.01 mil%
Classificação de países por estatísticas atuais por anos


Comentários: