29
/pt/
pt
AIzaSyAYiBZKx7MnpbEhh9jyipgxe19OcubqV5w
April 1, 2024
170088
Korea, Rep.
KOR
true
2
1
Inflation, GDP deflator (annual %)
2016,2015,2014,2013,2012,2011,2010,2009,2008,2007,2006,2005,2004,2003,2002,2001,2000,1999,1998,1997,1996,1995,1994,1993,1992,1991,1990,1989,1988,1987,1986,1985,1984,1983,1982,1981,1980,1979,1978,1977,1976,1975,1974,1973,1972,1971,1970,1969,1968,1967,1966,1965,1964,1963,1962
Estas estatísticas em outros países:
AfghanistanAlbaniaAlgeriaAndorraAngolaAntigua and BarbudaArab WorldArgentinaArmeniaArubaAustraliaAustriaAzerbaijanBahamas, TheBahrainBangladeshBarbadosBelarusBelgiumBelizeBeninBermudaBhutanBoliviaBosnia and HerzegovinaBotswanaBrazilBrunei DarussalamBulgariaBurkina FasoBurundiCabo VerdeCambodiaCameroonCanadaCaribbean small statesCayman IslandsCentral African RepublicCentral Europe and the BalticsChadChannel IslandsChileChinaColombiaComorosCongo, Dem. Rep.Congo, Rep.Costa RicaCote d'IvoireCroatiaCubaCyprusCzech RepublicDenmarkDjiboutiDominicaDominican RepublicEarly-demographic dividendEast Asia & PacificEast Asia & Pacific (excluding high income)East Asia & Pacific (IDA & IBRD countries)EcuadorEgypt, Arab Rep.El SalvadorEquatorial GuineaEritreaEstoniaEthiopiaEuro areaEurope & Central AsiaEurope & Central Asia (excluding high income)Europe & Central Asia (IDA & IBRD countries)European UnionFijiFinlandFragile and conflict affected situationsFranceFrench PolynesiaGabonGambia, TheGeorgiaGermanyGhanaGreeceGreenlandGrenadaGuatemalaGuineaGuinea-BissauGuyanaHaitiHeavily indebted poor countries (HIPC)High incomeHondurasHong Kong SAR, ChinaHungaryIBRD onlyIcelandIDA & IBRD totalIDA blendIDA onlyIDA totalIndiaIndonesiaIran, Islamic Rep.IraqIrelandIsle of ManIsraelItalyJamaicaJapanJordanKazakhstanKenyaKiribatiKorea, Rep.KosovoKuwaitKyrgyz RepublicLao PDRLate-demographic dividendLatin America & Caribbean Latin America & Caribbean (excluding high income)Latin America & the Caribbean (IDA & IBRD countries)LatviaLeast developed countries: UN classificationLebanonLesothoLiberiaLibyaLiechtensteinLithuaniaLow & middle incomeLow incomeLower middle incomeLuxembourgMacao SAR, ChinaMacedonia, FYRMadagascarMalawiMalaysiaMaldivesMaliMaltaMarshall IslandsMauritaniaMauritiusMexicoMicronesia, Fed. Sts.Middle East & North AfricaMiddle East & North Africa (excluding high income)Middle East & North Africa (IDA & IBRD countries)Middle incomeMoldovaMonacoMongoliaMontenegroMoroccoMozambiqueMyanmarNamibiaNauruNepalNetherlandsNew CaledoniaNew ZealandNicaraguaNigerNigeriaNorth AmericaNorwayOECD membersOmanOther small statesPacific island small statesPakistanPalauPanamaPapua New GuineaParaguayPeruPhilippinesPolandPortugalPost-demographic dividendPre-demographic dividendPuerto RicoQatarRomaniaRussian FederationRwandaSamoaSan MarinoSao Tome and PrincipeSaudi ArabiaSenegalSerbiaSeychellesSierra LeoneSingaporeSlovak RepublicSloveniaSmall statesSolomon IslandsSomaliaSouth AfricaSouth AsiaSouth Asia (IDA & IBRD)South SudanSpainSri LankaSt. Kitts and NevisSt. LuciaSt. Vincent and the GrenadinesSub-Saharan Africa Sub-Saharan Africa (excluding high income)Sub-Saharan Africa (IDA & IBRD countries)SudanSurinameSwazilandSwedenSwitzerlandSyrian Arab RepublicTajikistanTanzaniaThailandTimor-LesteTogoTongaTrinidad and TobagoTunisiaTurkeyTurkmenistanTuvaluUgandaUkraineUnited Arab EmiratesUnited KingdomUnited StatesUpper middle incomeUruguayUzbekistanVanuatuVenezuela, RBVietnamVirgin Islands (U.S.)West Bank and GazaWorldYemen, Rep.ZambiaZimbabwe Linha do tempo:
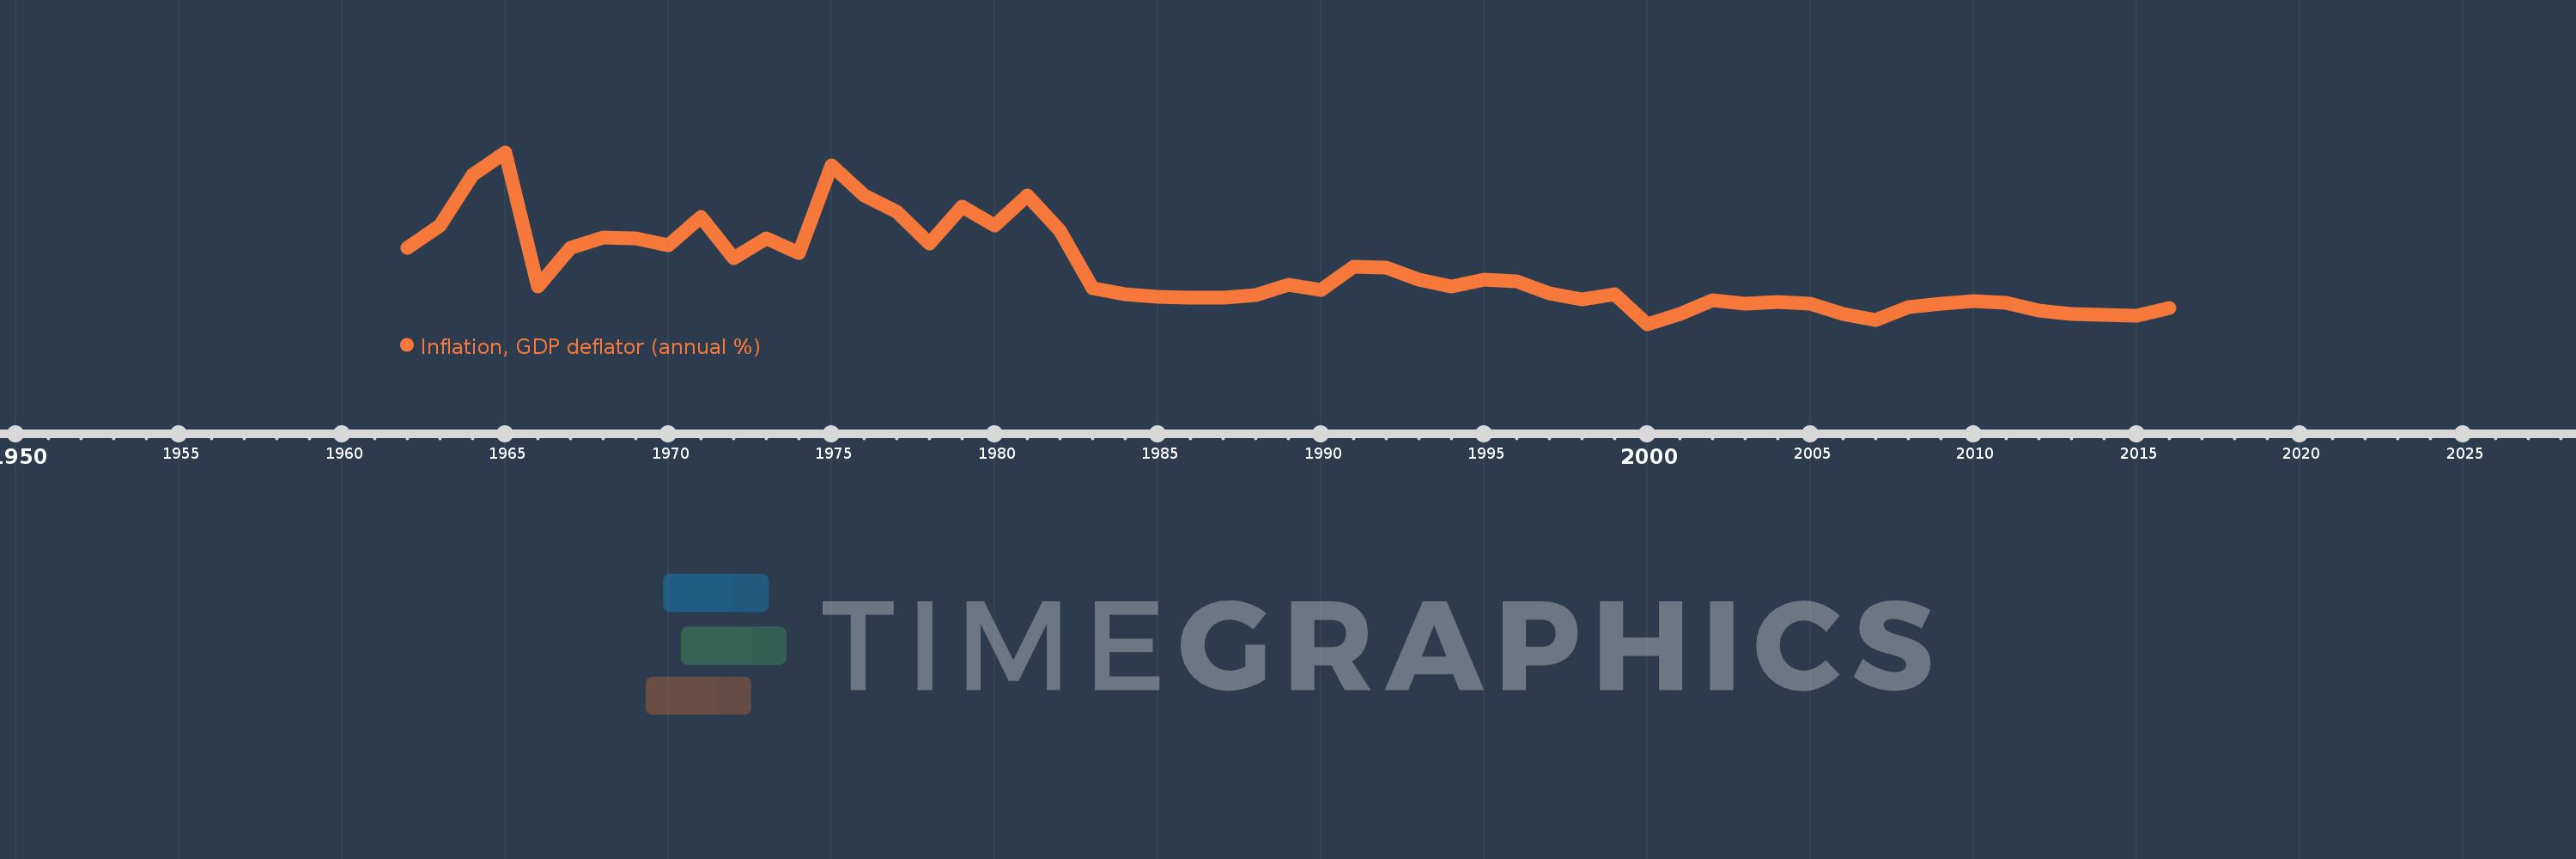
Nesta escala de tempo está apresentado um gráfico de 1962 ano até 2016 ano Korea, Rep.. Dados de 1961 ano ausente. O número de observações reais por data: 55.
Fonte (nome):
Indicadores de desenvolvimento mundial
Fonte (organização):
World Bank national accounts data, and OECD National Accounts data files.
Categorias:
Economy & Growth
Foi atualizado:
23 abr 2017 ano
Indicadores de alterações dos valores ao longo dos anos
Mínimo:
-1.043
1 jan 2000 ano
Máximo:
32.921
1 jan 1965 ano
Na data de observação
Valor
Mudança absoluta
A alteração em relação ao valor anterior
1 jan 1962 ano
14.097
+14.097
0.0%
1 jan 1963 ano
18.449
+4.352
30.87%
1 jan 1964 ano
28.462
+10.013
54.28%
1 jan 1965 ano
32.921
+4.459
15.67%
1 jan 1966 ano
6.42
-26.501
-80.5%
1 jan 1967 ano
13.99
+7.57
117.9%
1 jan 1968 ano
16.104
+2.114
15.11%
1 jan 1969 ano
15.94
-0.164
-1.02%
1 jan 1970 ano
14.594
-1.346
-8.44%
1 jan 1971 ano
20.19
+5.595
38.34%
1 jan 1972 ano
12.062
-8.128
-40.26%
1 jan 1973 ano
15.94
+3.878
32.15%
1 jan 1974 ano
12.957
-2.983
-18.71%
1 jan 1975 ano
30.433
+17.476
134.88%
1 jan 1976 ano
24.423
-6.01
-19.75%
1 jan 1977 ano
21.223
-3.2
-13.1%
1 jan 1978 ano
14.82
-6.404
-30.17%
1 jan 1979 ano
22.235
+7.415
50.04%
1 jan 1980 ano
18.537
-3.698
-16.63%
1 jan 1981 ano
24.381
+5.844
31.53%
1 jan 1982 ano
17.38
-7.002
-28.72%
1 jan 1983 ano
6.149
-11.231
-64.62%
1 jan 1984 ano
4.881
-1.267
-20.61%
1 jan 1985 ano
4.455
-0.426
-8.73%
1 jan 1986 ano
4.205
-0.25
-5.61%
1 jan 1987 ano
4.227
+0.022
0.51%
1 jan 1988 ano
4.786
+0.559
13.23%
1 jan 1989 ano
6.708
+1.922
40.16%
1 jan 1990 ano
5.737
-0.971
-14.47%
1 jan 1991 ano
10.391
+4.654
81.12%
1 jan 1992 ano
10.219
-0.173
-1.66%
1 jan 1993 ano
7.853
-2.365
-23.15%
1 jan 1994 ano
6.434
-1.42
-18.08%
1 jan 1995 ano
7.694
+1.261
19.6%
1 jan 1996 ano
7.456
-0.238
-3.09%
1 jan 1997 ano
4.979
-2.478
-33.23%
1 jan 1998 ano
3.852
-1.127
-22.64%
1 jan 1999 ano
4.953
+1.101
28.58%
1 jan 2000 ano
-1.043
-5.996
-121.05%
1 jan 2001 ano
0.951
+1.994
-191.24%
1 jan 2002 ano
3.65
+2.699
283.68%
1 jan 2003 ano
3.061
-0.59
-16.16%
1 jan 2004 ano
3.395
+0.335
10.93%
1 jan 2005 ano
2.984
-0.411
-12.11%
1 jan 2006 ano
1.032
-1.953
-65.43%
1 jan 2007 ano
-0.14
-1.171
-113.55%
1 jan 2008 ano
2.397
+2.537
-1.81 mil%
1 jan 2009 ano
2.957
+0.559
23.34%
1 jan 2010 ano
3.542
+0.586
19.81%
1 jan 2011 ano
3.161
-0.381
-10.75%
1 jan 2012 ano
1.585
-1.577
-49.88%
1 jan 2013 ano
1.044
-0.541
-34.15%
1 jan 2014 ano
0.853
-0.19
-18.23%
1 jan 2015 ano
0.6
-0.253
-29.64%
1 jan 2016 ano
2.21
+1.609
268.03%
Classificação de países por estatísticas atuais por anos


Comentários: