29
/pt/
pt
AIzaSyAYiBZKx7MnpbEhh9jyipgxe19OcubqV5w
April 1, 2024
150531
Honduras
HND
true
2
1
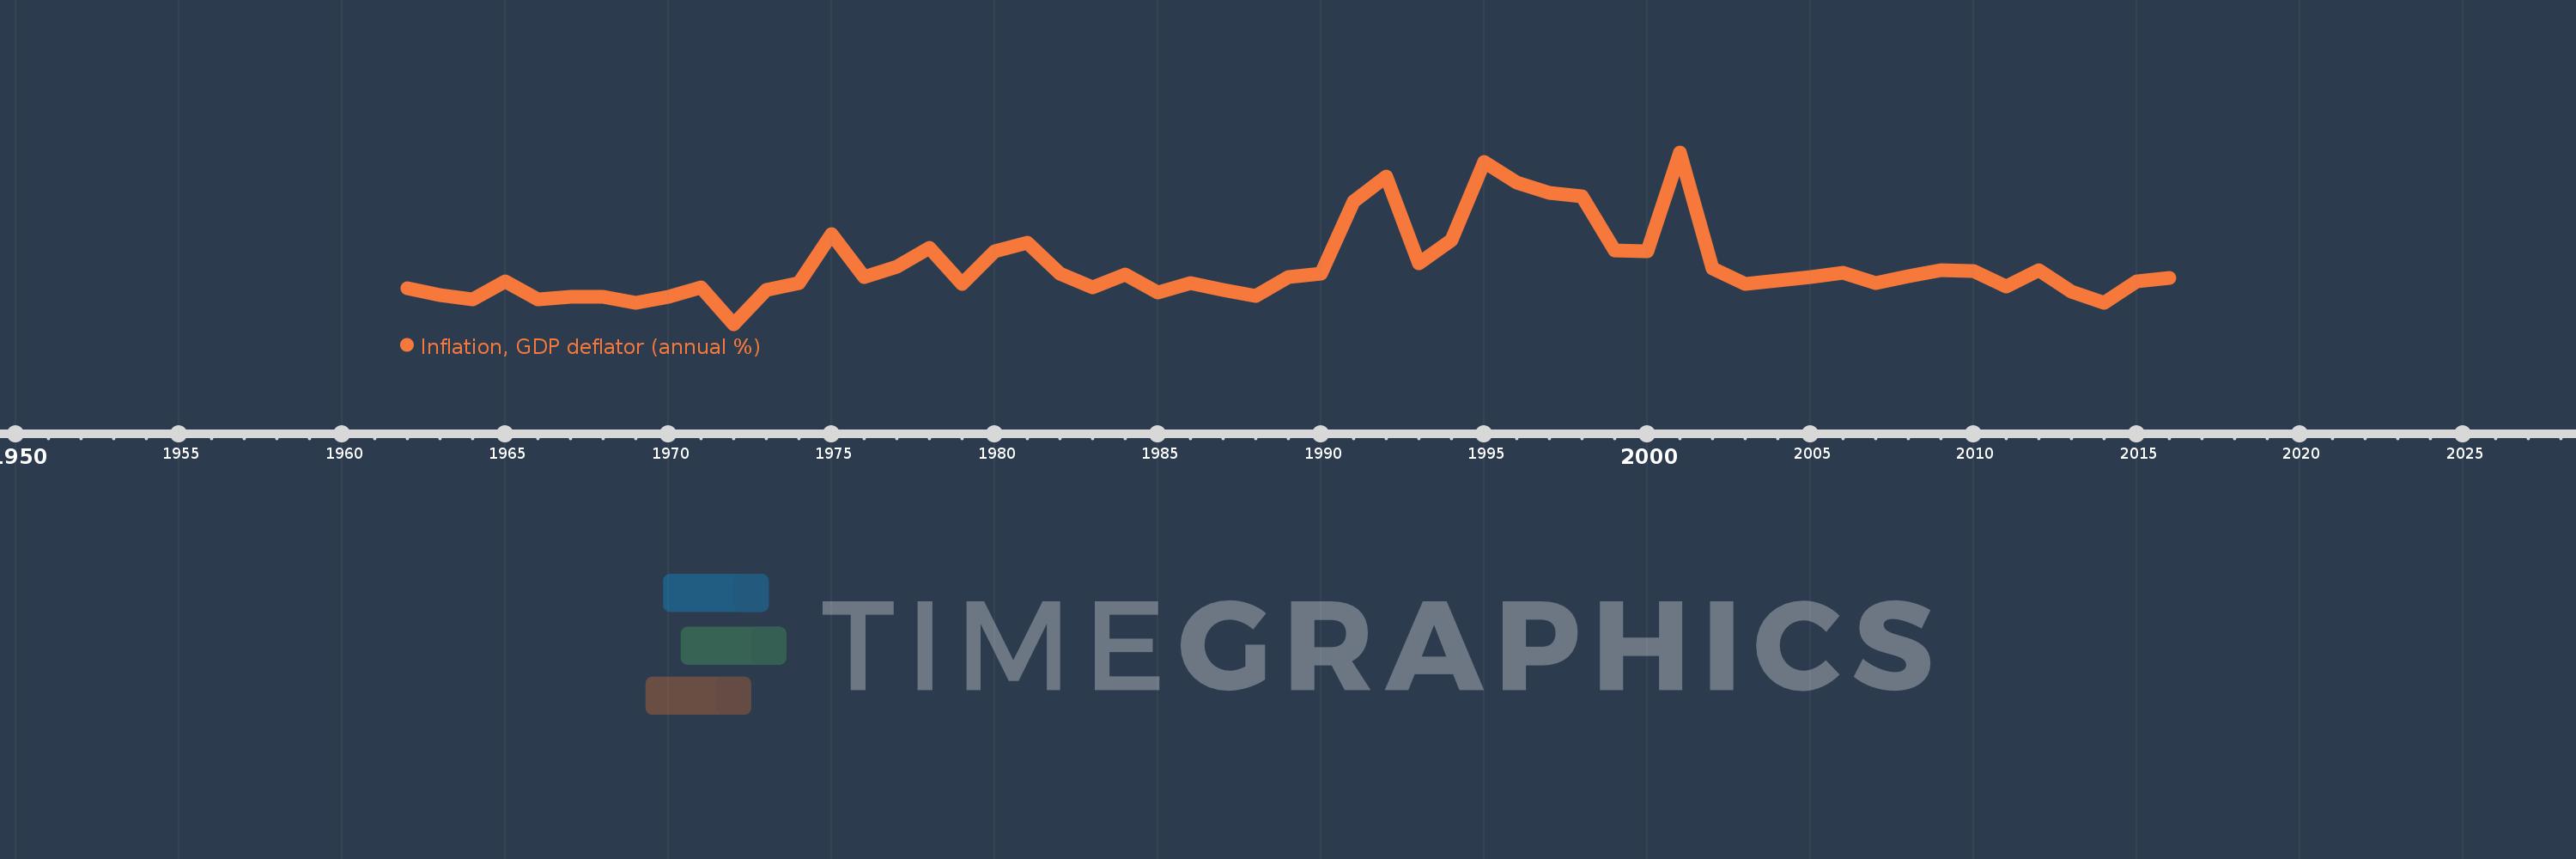
Inflation, GDP deflator (annual %)
2016,2015,2014,2013,2012,2011,2010,2009,2008,2007,2006,2005,2004,2003,2002,2001,2000,1999,1998,1997,1996,1995,1994,1993,1992,1991,1990,1989,1988,1987,1986,1985,1984,1983,1982,1981,1980,1979,1978,1977,1976,1975,1974,1973,1972,1971,1970,1969,1968,1967,1966,1965,1964,1963,1962
Estas estatísticas em outros países:
AfghanistanAlbaniaAlgeriaAndorraAngolaAntigua and BarbudaArab WorldArgentinaArmeniaArubaAustraliaAustriaAzerbaijanBahamas, TheBahrainBangladeshBarbadosBelarusBelgiumBelizeBeninBermudaBhutanBoliviaBosnia and HerzegovinaBotswanaBrazilBrunei DarussalamBulgariaBurkina FasoBurundiCabo VerdeCambodiaCameroonCanadaCaribbean small statesCayman IslandsCentral African RepublicCentral Europe and the BalticsChadChannel IslandsChileChinaColombiaComorosCongo, Dem. Rep.Congo, Rep.Costa RicaCote d'IvoireCroatiaCubaCyprusCzech RepublicDenmarkDjiboutiDominicaDominican RepublicEarly-demographic dividendEast Asia & PacificEast Asia & Pacific (excluding high income)East Asia & Pacific (IDA & IBRD countries)EcuadorEgypt, Arab Rep.El SalvadorEquatorial GuineaEritreaEstoniaEthiopiaEuro areaEurope & Central AsiaEurope & Central Asia (excluding high income)Europe & Central Asia (IDA & IBRD countries)European UnionFijiFinlandFragile and conflict affected situationsFranceFrench PolynesiaGabonGambia, TheGeorgiaGermanyGhanaGreeceGreenlandGrenadaGuatemalaGuineaGuinea-BissauGuyanaHaitiHeavily indebted poor countries (HIPC)High incomeHondurasHong Kong SAR, ChinaHungaryIBRD onlyIcelandIDA & IBRD totalIDA blendIDA onlyIDA totalIndiaIndonesiaIran, Islamic Rep.IraqIrelandIsle of ManIsraelItalyJamaicaJapanJordanKazakhstanKenyaKiribatiKorea, Rep.KosovoKuwaitKyrgyz RepublicLao PDRLate-demographic dividendLatin America & Caribbean Latin America & Caribbean (excluding high income)Latin America & the Caribbean (IDA & IBRD countries)LatviaLeast developed countries: UN classificationLebanonLesothoLiberiaLibyaLiechtensteinLithuaniaLow & middle incomeLow incomeLower middle incomeLuxembourgMacao SAR, ChinaMacedonia, FYRMadagascarMalawiMalaysiaMaldivesMaliMaltaMarshall IslandsMauritaniaMauritiusMexicoMicronesia, Fed. Sts.Middle East & North AfricaMiddle East & North Africa (excluding high income)Middle East & North Africa (IDA & IBRD countries)Middle incomeMoldovaMonacoMongoliaMontenegroMoroccoMozambiqueMyanmarNamibiaNauruNepalNetherlandsNew CaledoniaNew ZealandNicaraguaNigerNigeriaNorth AmericaNorwayOECD membersOmanOther small statesPacific island small statesPakistanPalauPanamaPapua New GuineaParaguayPeruPhilippinesPolandPortugalPost-demographic dividendPre-demographic dividendPuerto RicoQatarRomaniaRussian FederationRwandaSamoaSan MarinoSao Tome and PrincipeSaudi ArabiaSenegalSerbiaSeychellesSierra LeoneSingaporeSlovak RepublicSloveniaSmall statesSolomon IslandsSomaliaSouth AfricaSouth AsiaSouth Asia (IDA & IBRD)South SudanSpainSri LankaSt. Kitts and NevisSt. LuciaSt. Vincent and the GrenadinesSub-Saharan Africa Sub-Saharan Africa (excluding high income)Sub-Saharan Africa (IDA & IBRD countries)SudanSurinameSwazilandSwedenSwitzerlandSyrian Arab RepublicTajikistanTanzaniaThailandTimor-LesteTogoTongaTrinidad and TobagoTunisiaTurkeyTurkmenistanTuvaluUgandaUkraineUnited Arab EmiratesUnited KingdomUnited StatesUpper middle incomeUruguayUzbekistanVanuatuVenezuela, RBVietnamVirgin Islands (U.S.)West Bank and GazaWorldYemen, Rep.ZambiaZimbabwe Linha do tempo:
Nesta escala de tempo está apresentado um gráfico de 1962 ano até 2016 ano Honduras. Dados de 1961 ano ausente. O número de observações reais por data: 55.
Fonte (nome):
Indicadores de desenvolvimento mundial
Fonte (organização):
World Bank national accounts data, and OECD National Accounts data files.
Categorias:
Economy & Growth
Foi atualizado:
23 abr 2017 ano
Indicadores de alterações dos valores ao longo dos anos
Mínimo:
-2.778
1 jan 1972 ano
Máximo:
30.82
1 jan 2001 ano
Na data de observação
Valor
Mudança absoluta
A alteração em relação ao valor anterior
1 jan 1962 ano
4.189
+4.189
0.0%
1 jan 1963 ano
2.924
-1.265
-30.2%
1 jan 1964 ano
2.133
-0.791
-27.05%
1 jan 1965 ano
5.685
+3.552
166.5%
1 jan 1966 ano
2.077
-3.607
-63.46%
1 jan 1967 ano
2.606
+0.529
25.45%
1 jan 1968 ano
2.621
+0.015
0.59%
1 jan 1969 ano
1.449
-1.172
-44.73%
1 jan 1970 ano
2.605
+1.156
79.83%
1 jan 1971 ano
4.446
+1.84
70.64%
1 jan 1972 ano
-2.778
-7.223
-162.48%
1 jan 1973 ano
3.865
+6.642
-239.13%
1 jan 1974 ano
5.346
+1.481
38.33%
1 jan 1975 ano
14.779
+9.433
176.46%
1 jan 1976 ano
6.385
-8.394
-56.8%
1 jan 1977 ano
8.532
+2.147
33.63%
1 jan 1978 ano
12.199
+3.667
42.98%
1 jan 1979 ano
5.061
-7.138
-58.51%
1 jan 1980 ano
11.488
+6.427
126.97%
1 jan 1981 ano
13.212
+1.724
15.0%
1 jan 1982 ano
7.164
-6.047
-45.77%
1 jan 1983 ano
4.432
-2.732
-38.14%
1 jan 1984 ano
6.964
+2.532
57.13%
1 jan 1985 ano
3.373
-3.592
-51.57%
1 jan 1986 ano
5.248
+1.876
55.62%
1 jan 1987 ano
3.893
-1.356
-25.83%
1 jan 1988 ano
2.83
-1.062
-27.29%
1 jan 1989 ano
6.482
+3.652
129.02%
1 jan 1990 ano
7.075
+0.593
9.15%
1 jan 1991 ano
21.201
+14.126
199.66%
1 jan 1992 ano
26.028
+4.828
22.77%
1 jan 1993 ano
9.102
-16.926
-65.03%
1 jan 1994 ano
13.608
+4.506
49.51%
1 jan 1995 ano
28.887
+15.278
112.27%
1 jan 1996 ano
24.879
-4.008
-13.87%
1 jan 1997 ano
22.925
-1.954
-7.86%
1 jan 1998 ano
22.28
-0.645
-2.81%
1 jan 1999 ano
11.629
-10.651
-47.81%
1 jan 2000 ano
11.56
-0.068
-0.59%
1 jan 2001 ano
30.82
+19.26
166.6%
1 jan 2002 ano
8.084
-22.735
-73.77%
1 jan 2003 ano
5.132
-2.952
-36.52%
1 jan 2004 ano
5.76
+0.628
12.23%
1 jan 2005 ano
6.452
+0.692
12.02%
1 jan 2006 ano
7.279
+0.827
12.82%
1 jan 2007 ano
5.349
-1.931
-26.52%
1 jan 2008 ano
6.626
+1.277
23.87%
1 jan 2009 ano
7.791
+1.165
17.58%
1 jan 2010 ano
7.654
-0.137
-1.76%
1 jan 2011 ano
4.676
-2.978
-38.91%
1 jan 2012 ano
7.807
+3.131
66.96%
1 jan 2013 ano
3.58
-4.227
-54.15%
1 jan 2014 ano
1.374
-2.206
-61.62%
1 jan 2015 ano
5.527
+4.153
302.28%
1 jan 2016 ano
6.3
+0.772
13.97%
Classificação de países por estatísticas atuais por anos


Comentários: