29
/pt/
pt
AIzaSyAYiBZKx7MnpbEhh9jyipgxe19OcubqV5w
April 1, 2024
242393
Slovenia
SVN
true
2
1
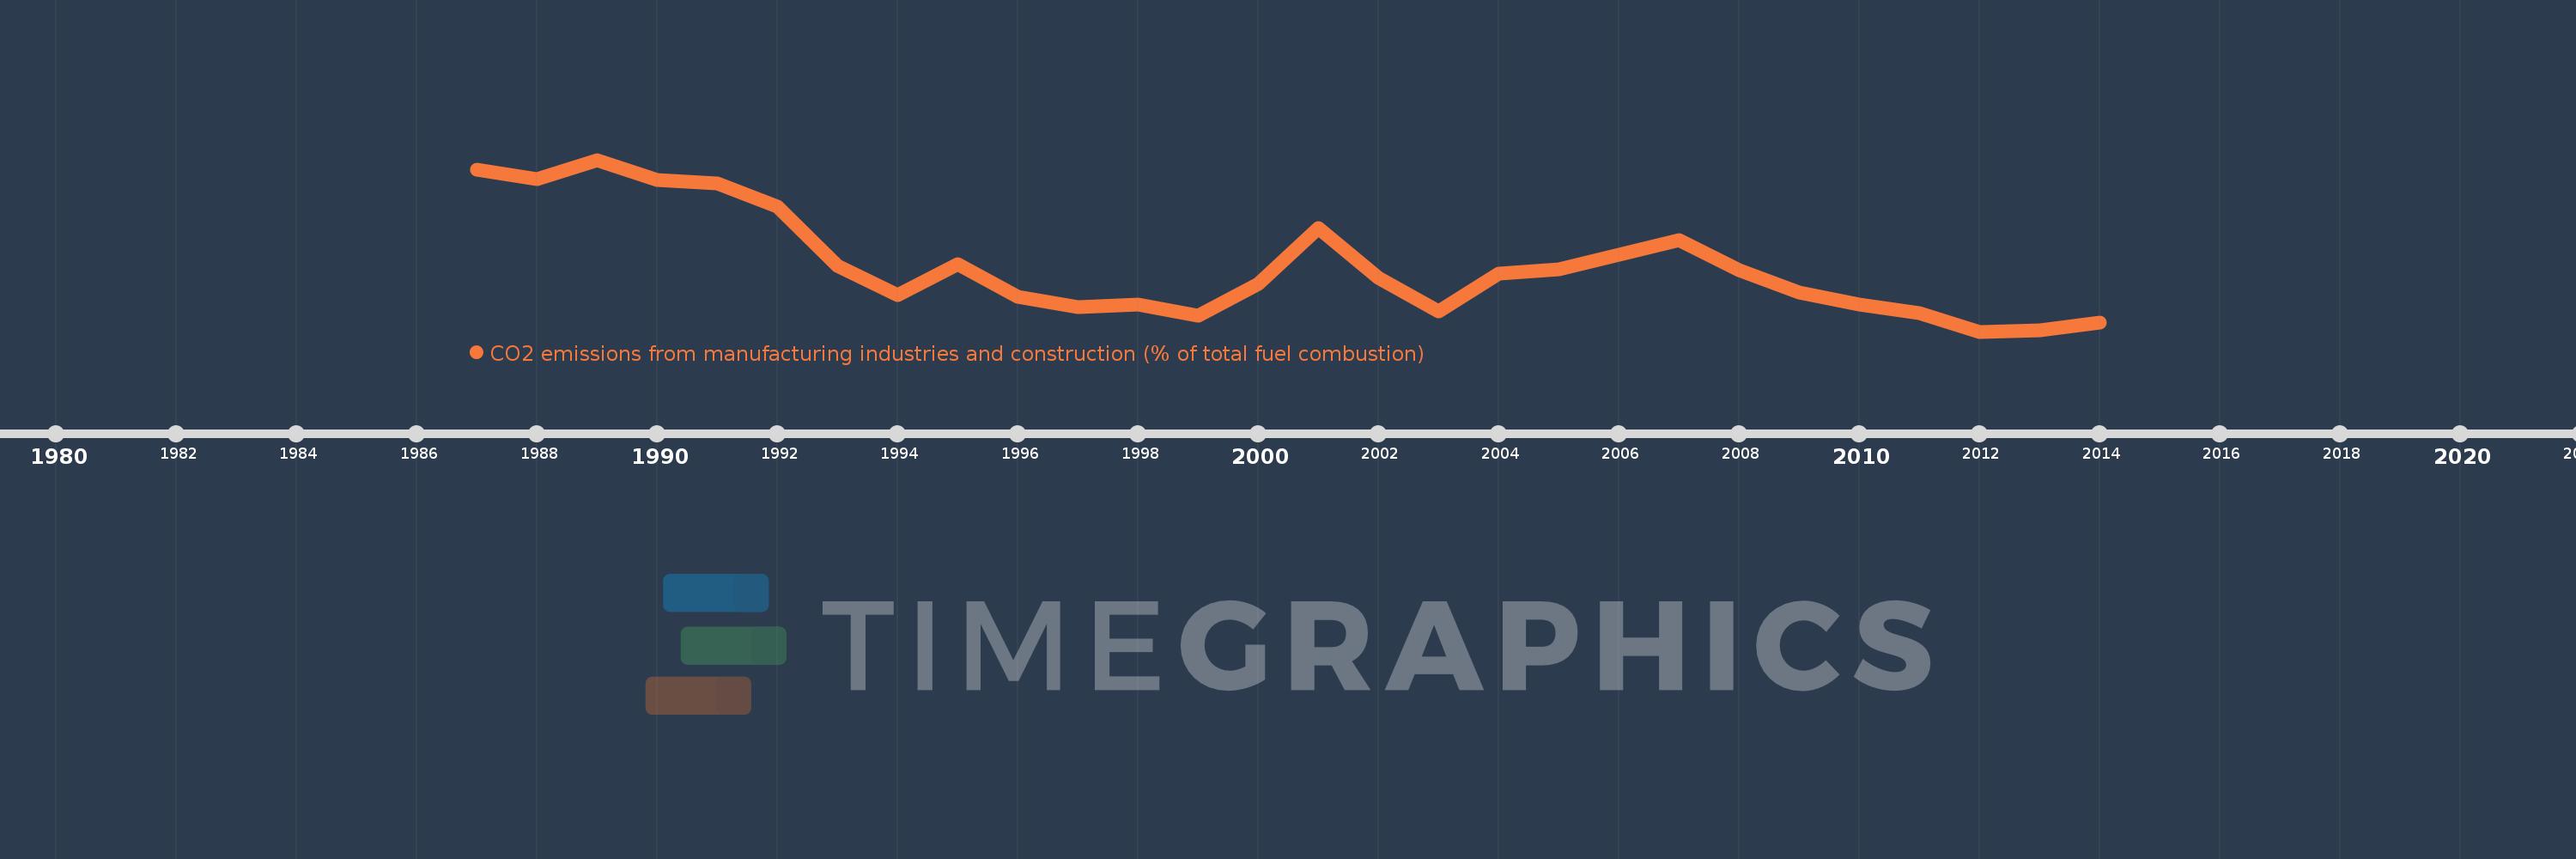
CO2 emissions from manufacturing industries and construction (% of total fuel combustion)
2014,2013,2012,2011,2010,2009,2008,2007,2006,2005,2004,2003,2002,2001,2000,1999,1998,1997,1996,1995,1994,1993,1992,1991,1990,1989,1988,1987
Estas estatísticas em outros países:
AlbaniaAlgeriaAngolaArab WorldArgentinaArmeniaAustraliaAustriaAzerbaijanBahrainBangladeshBelarusBelgiumBeninBoliviaBosnia and HerzegovinaBotswanaBrazilBrunei DarussalamBulgariaCambodiaCameroonCanadaCaribbean small statesCentral Europe and the BalticsChileChinaColombiaCongo, Dem. Rep.Congo, Rep.Costa RicaCote d'IvoireCroatiaCubaCuracaoCyprusCzech RepublicDenmarkDominican RepublicEarly-demographic dividendEast Asia & PacificEast Asia & Pacific (excluding high income)East Asia & Pacific (IDA & IBRD countries)EcuadorEgypt, Arab Rep.El SalvadorEritreaEstoniaEthiopiaEuro areaEurope & Central AsiaEurope & Central Asia (excluding high income)Europe & Central Asia (IDA & IBRD countries)European UnionFinlandFragile and conflict affected situationsFranceGabonGeorgiaGermanyGhanaGibraltarGreeceGuatemalaHaitiHeavily indebted poor countries (HIPC)High incomeHondurasHong Kong SAR, ChinaHungaryIBRD onlyIcelandIDA & IBRD totalIDA blendIDA onlyIDA totalIndiaIndonesiaIran, Islamic Rep.IraqIrelandIsraelItalyJamaicaJapanJordanKazakhstanKenyaKorea, Dem. People’s Rep.Korea, Rep.KosovoKuwaitKyrgyz RepublicLate-demographic dividendLatin America & Caribbean Latin America & Caribbean (excluding high income)Latin America & the Caribbean (IDA & IBRD countries)LatviaLeast developed countries: UN classificationLebanonLibyaLithuaniaLow & middle incomeLow incomeLower middle incomeLuxembourgMacedonia, FYRMalaysiaMaltaMauritiusMexicoMiddle East & North AfricaMiddle East & North Africa (excluding high income)Middle East & North Africa (IDA & IBRD countries)Middle incomeMoldovaMongoliaMontenegroMoroccoMozambiqueMyanmarNamibiaNepalNetherlandsNew ZealandNicaraguaNigerNigeriaNorth AmericaNorwayOECD membersOmanOther small statesPakistanPanamaParaguayPeruPhilippinesPolandPortugalPost-demographic dividendPre-demographic dividendQatarRomaniaRussian FederationSaudi ArabiaSenegalSerbiaSingaporeSlovak RepublicSloveniaSmall statesSouth AfricaSouth AsiaSouth Asia (IDA & IBRD)South SudanSpainSri LankaSub-Saharan Africa Sub-Saharan Africa (excluding high income)Sub-Saharan Africa (IDA & IBRD countries)SudanSwedenSwitzerlandSyrian Arab RepublicTajikistanTanzaniaThailandTogoTrinidad and TobagoTunisiaTurkeyTurkmenistanUkraineUnited Arab EmiratesUnited KingdomUnited StatesUpper middle incomeUruguayUzbekistanVenezuela, RBVietnamWorldYemen, Rep.ZambiaZimbabwe Linha do tempo:
Nesta escala de tempo está apresentado um gráfico de 1987 ano até 2014 ano Slovenia. Dados de 1986 ano ausente. O número de observações reais por data: 28.
Fonte (nome):
Indicadores de desenvolvimento mundial
Fonte (organização):
IEA Statistics © OECD/IEA 2014 (http://www.iea.org/stats/index.asp), subject to https://www.iea.org/t&c/termsandconditions/
Categorias:
Environment
Foi atualizado:
23 abr 2017 ano
Indicadores de alterações dos valores ao longo dos anos
Mínimo:
11.147
1 jan 2012 ano
Máximo:
20.633
1 jan 1989 ano
Na data de observação
Valor
Mudança absoluta
A alteração em relação ao valor anterior
1 jan 1987 ano
20.109
+20.109
0.0%
1 jan 1988 ano
19.574
-0.535
-2.66%
1 jan 1989 ano
20.633
+1.058
5.41%
1 jan 1990 ano
19.51
-1.122
-5.44%
1 jan 1991 ano
19.35
-0.16
-0.82%
1 jan 1992 ano
18.039
-1.311
-6.77%
1 jan 1993 ano
14.779
-3.26
-18.07%
1 jan 1994 ano
13.178
-1.601
-10.84%
1 jan 1995 ano
14.89
+1.713
13.0%
1 jan 1996 ano
13.077
-1.813
-12.18%
1 jan 1997 ano
12.517
-0.561
-4.29%
1 jan 1998 ano
12.623
+0.106
0.85%
1 jan 1999 ano
12.027
-0.596
-4.72%
1 jan 2000 ano
13.772
+1.745
14.51%
1 jan 2001 ano
16.856
+3.085
22.4%
1 jan 2002 ano
14.113
-2.743
-16.28%
1 jan 2003 ano
12.26
-1.853
-13.13%
1 jan 2004 ano
14.362
+2.102
17.15%
1 jan 2005 ano
14.567
+0.205
1.43%
1 jan 2006 ano
15.405
+0.838
5.75%
1 jan 2007 ano
16.192
+0.788
5.11%
1 jan 2008 ano
14.558
-1.634
-10.09%
1 jan 2009 ano
13.313
-1.245
-8.55%
1 jan 2010 ano
12.641
-0.672
-5.05%
1 jan 2011 ano
12.168
-0.473
-3.74%
1 jan 2012 ano
11.147
-1.021
-8.39%
1 jan 2013 ano
11.231
+0.084
0.75%
1 jan 2014 ano
11.646
+0.415
3.7%
Classificação de países por estatísticas atuais por anos


Comentários: