29
/pt/
pt
AIzaSyAYiBZKx7MnpbEhh9jyipgxe19OcubqV5w
April 1, 2024
210117
Nicaragua
NIC
true
2
1
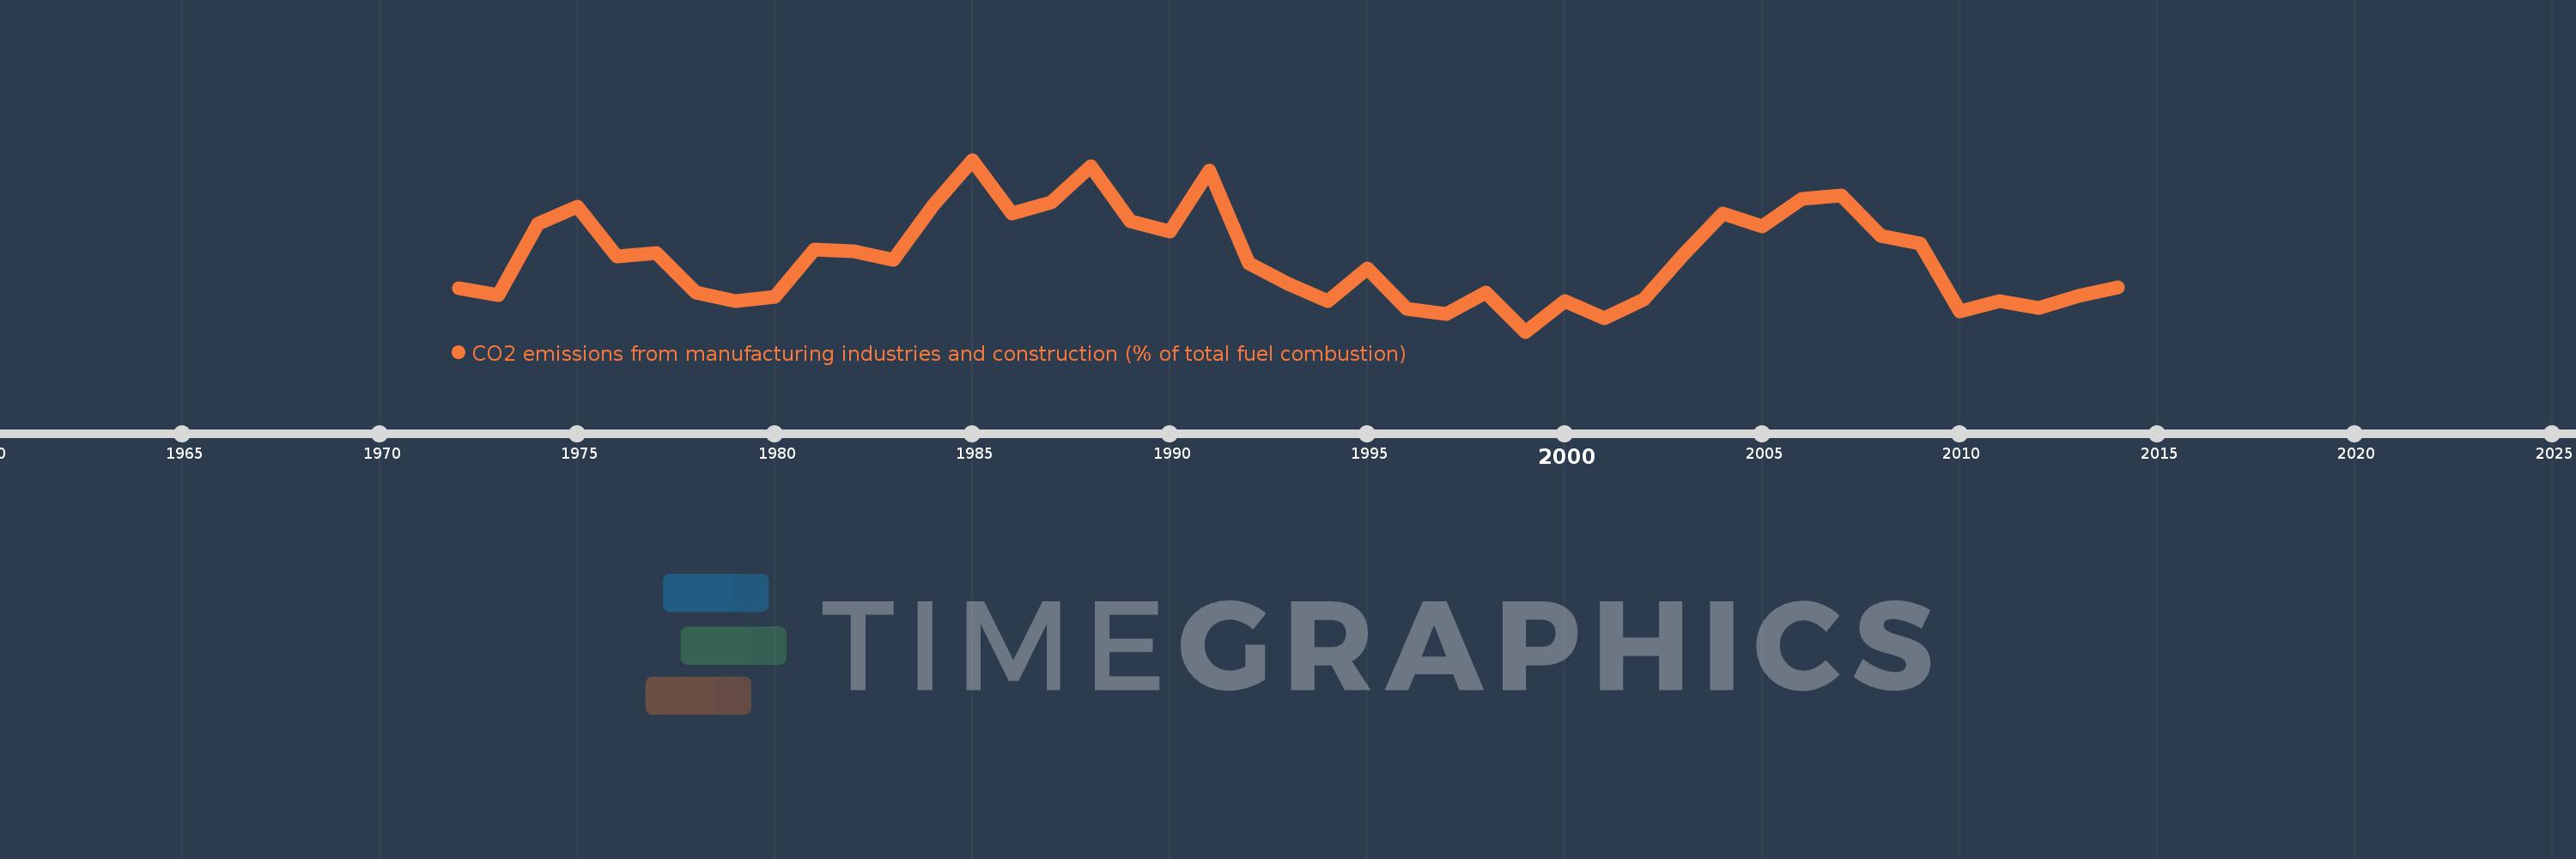
CO2 emissions from manufacturing industries and construction (% of total fuel combustion)
2014,2013,2012,2011,2010,2009,2008,2007,2006,2005,2004,2003,2002,2001,2000,1999,1998,1997,1996,1995,1994,1993,1992,1991,1990,1989,1988,1987,1986,1985,1984,1983,1982,1981,1980,1979,1978,1977,1976,1975,1974,1973,1972
Estas estatísticas em outros países:
AlbaniaAlgeriaAngolaArab WorldArgentinaArmeniaAustraliaAustriaAzerbaijanBahrainBangladeshBelarusBelgiumBeninBoliviaBosnia and HerzegovinaBotswanaBrazilBrunei DarussalamBulgariaCambodiaCameroonCanadaCaribbean small statesCentral Europe and the BalticsChileChinaColombiaCongo, Dem. Rep.Congo, Rep.Costa RicaCote d'IvoireCroatiaCubaCuracaoCyprusCzech RepublicDenmarkDominican RepublicEarly-demographic dividendEast Asia & PacificEast Asia & Pacific (excluding high income)East Asia & Pacific (IDA & IBRD countries)EcuadorEgypt, Arab Rep.El SalvadorEritreaEstoniaEthiopiaEuro areaEurope & Central AsiaEurope & Central Asia (excluding high income)Europe & Central Asia (IDA & IBRD countries)European UnionFinlandFragile and conflict affected situationsFranceGabonGeorgiaGermanyGhanaGibraltarGreeceGuatemalaHaitiHeavily indebted poor countries (HIPC)High incomeHondurasHong Kong SAR, ChinaHungaryIBRD onlyIcelandIDA & IBRD totalIDA blendIDA onlyIDA totalIndiaIndonesiaIran, Islamic Rep.IraqIrelandIsraelItalyJamaicaJapanJordanKazakhstanKenyaKorea, Dem. People’s Rep.Korea, Rep.KosovoKuwaitKyrgyz RepublicLate-demographic dividendLatin America & Caribbean Latin America & Caribbean (excluding high income)Latin America & the Caribbean (IDA & IBRD countries)LatviaLeast developed countries: UN classificationLebanonLibyaLithuaniaLow & middle incomeLow incomeLower middle incomeLuxembourgMacedonia, FYRMalaysiaMaltaMauritiusMexicoMiddle East & North AfricaMiddle East & North Africa (excluding high income)Middle East & North Africa (IDA & IBRD countries)Middle incomeMoldovaMongoliaMontenegroMoroccoMozambiqueMyanmarNamibiaNepalNetherlandsNew ZealandNicaraguaNigerNigeriaNorth AmericaNorwayOECD membersOmanOther small statesPakistanPanamaParaguayPeruPhilippinesPolandPortugalPost-demographic dividendPre-demographic dividendQatarRomaniaRussian FederationSaudi ArabiaSenegalSerbiaSingaporeSlovak RepublicSloveniaSmall statesSouth AfricaSouth AsiaSouth Asia (IDA & IBRD)South SudanSpainSri LankaSub-Saharan Africa Sub-Saharan Africa (excluding high income)Sub-Saharan Africa (IDA & IBRD countries)SudanSwedenSwitzerlandSyrian Arab RepublicTajikistanTanzaniaThailandTogoTrinidad and TobagoTunisiaTurkeyTurkmenistanUkraineUnited Arab EmiratesUnited KingdomUnited StatesUpper middle incomeUruguayUzbekistanVenezuela, RBVietnamWorldYemen, Rep.ZambiaZimbabwe Linha do tempo:
Nesta escala de tempo está apresentado um gráfico de 1972 ano até 2014 ano Nicaragua. Dados de 1971 ano ausente. O número de observações reais por data: 43.
Fonte (nome):
Indicadores de desenvolvimento mundial
Fonte (organização):
IEA Statistics © OECD/IEA 2014 (http://www.iea.org/stats/index.asp), subject to https://www.iea.org/t&c/termsandconditions/
Categorias:
Environment
Foi atualizado:
23 abr 2017 ano
Indicadores de alterações dos valores ao longo dos anos
Mínimo:
10.119
1 jan 1999 ano
Máximo:
17.877
1 jan 1985 ano
Na data de observação
Valor
Mudança absoluta
A alteração em relação ao valor anterior
1 jan 1972 ano
12.081
+12.081
0.0%
1 jan 1973 ano
11.765
-0.316
-2.61%
1 jan 1974 ano
14.97
+3.205
27.25%
1 jan 1975 ano
15.761
+0.791
5.28%
1 jan 1976 ano
13.514
-2.247
-14.26%
1 jan 1977 ano
13.679
+0.166
1.23%
1 jan 1978 ano
11.877
-1.802
-13.17%
1 jan 1979 ano
11.489
-0.388
-3.27%
1 jan 1980 ano
11.688
+0.199
1.73%
1 jan 1981 ano
13.812
+2.124
18.17%
1 jan 1982 ano
13.757
-0.056
-0.4%
1 jan 1983 ano
13.369
-0.388
-2.82%
1 jan 1984 ano
15.816
+2.447
18.31%
1 jan 1985 ano
17.877
+2.061
13.03%
1 jan 1986 ano
15.47
-2.407
-13.47%
1 jan 1987 ano
15.962
+0.493
3.19%
1 jan 1988 ano
17.593
+1.63
10.21%
1 jan 1989 ano
15.104
-2.488
-14.14%
1 jan 1990 ano
14.62
-0.484
-3.21%
1 jan 1991 ano
17.391
+2.771
18.96%
1 jan 1992 ano
13.187
-4.204
-24.18%
1 jan 1993 ano
12.264
-0.923
-7.0%
1 jan 1994 ano
11.483
-0.781
-6.37%
1 jan 1995 ano
12.971
+1.487
12.95%
1 jan 1996 ano
11.155
-1.815
-14.0%
1 jan 1997 ano
10.902
-0.253
-2.27%
1 jan 1998 ano
11.888
+0.986
9.04%
1 jan 1999 ano
10.119
-1.769
-14.88%
1 jan 2000 ano
11.504
+1.385
13.69%
1 jan 2001 ano
10.734
-0.77
-6.69%
1 jan 2002 ano
11.59
+0.856
7.97%
1 jan 2003 ano
13.577
+1.987
17.14%
1 jan 2004 ano
15.443
+1.866
13.74%
1 jan 2005 ano
14.878
-0.565
-3.66%
1 jan 2006 ano
16.129
+1.251
8.41%
1 jan 2007 ano
16.274
+0.145
0.9%
1 jan 2008 ano
14.45
-1.824
-11.21%
1 jan 2009 ano
14.081
-0.368
-2.55%
1 jan 2010 ano
11.031
-3.05
-21.66%
1 jan 2011 ano
11.494
+0.463
4.2%
1 jan 2012 ano
11.186
-0.309
-2.68%
1 jan 2013 ano
11.738
+0.552
4.94%
1 jan 2014 ano
12.114
+0.376
3.2%
Classificação de países por estatísticas atuais por anos


Comentários: