29
/pt/
pt
AIzaSyAYiBZKx7MnpbEhh9jyipgxe19OcubqV5w
April 1, 2024
176165
Lebanon
LBN
true
2
1
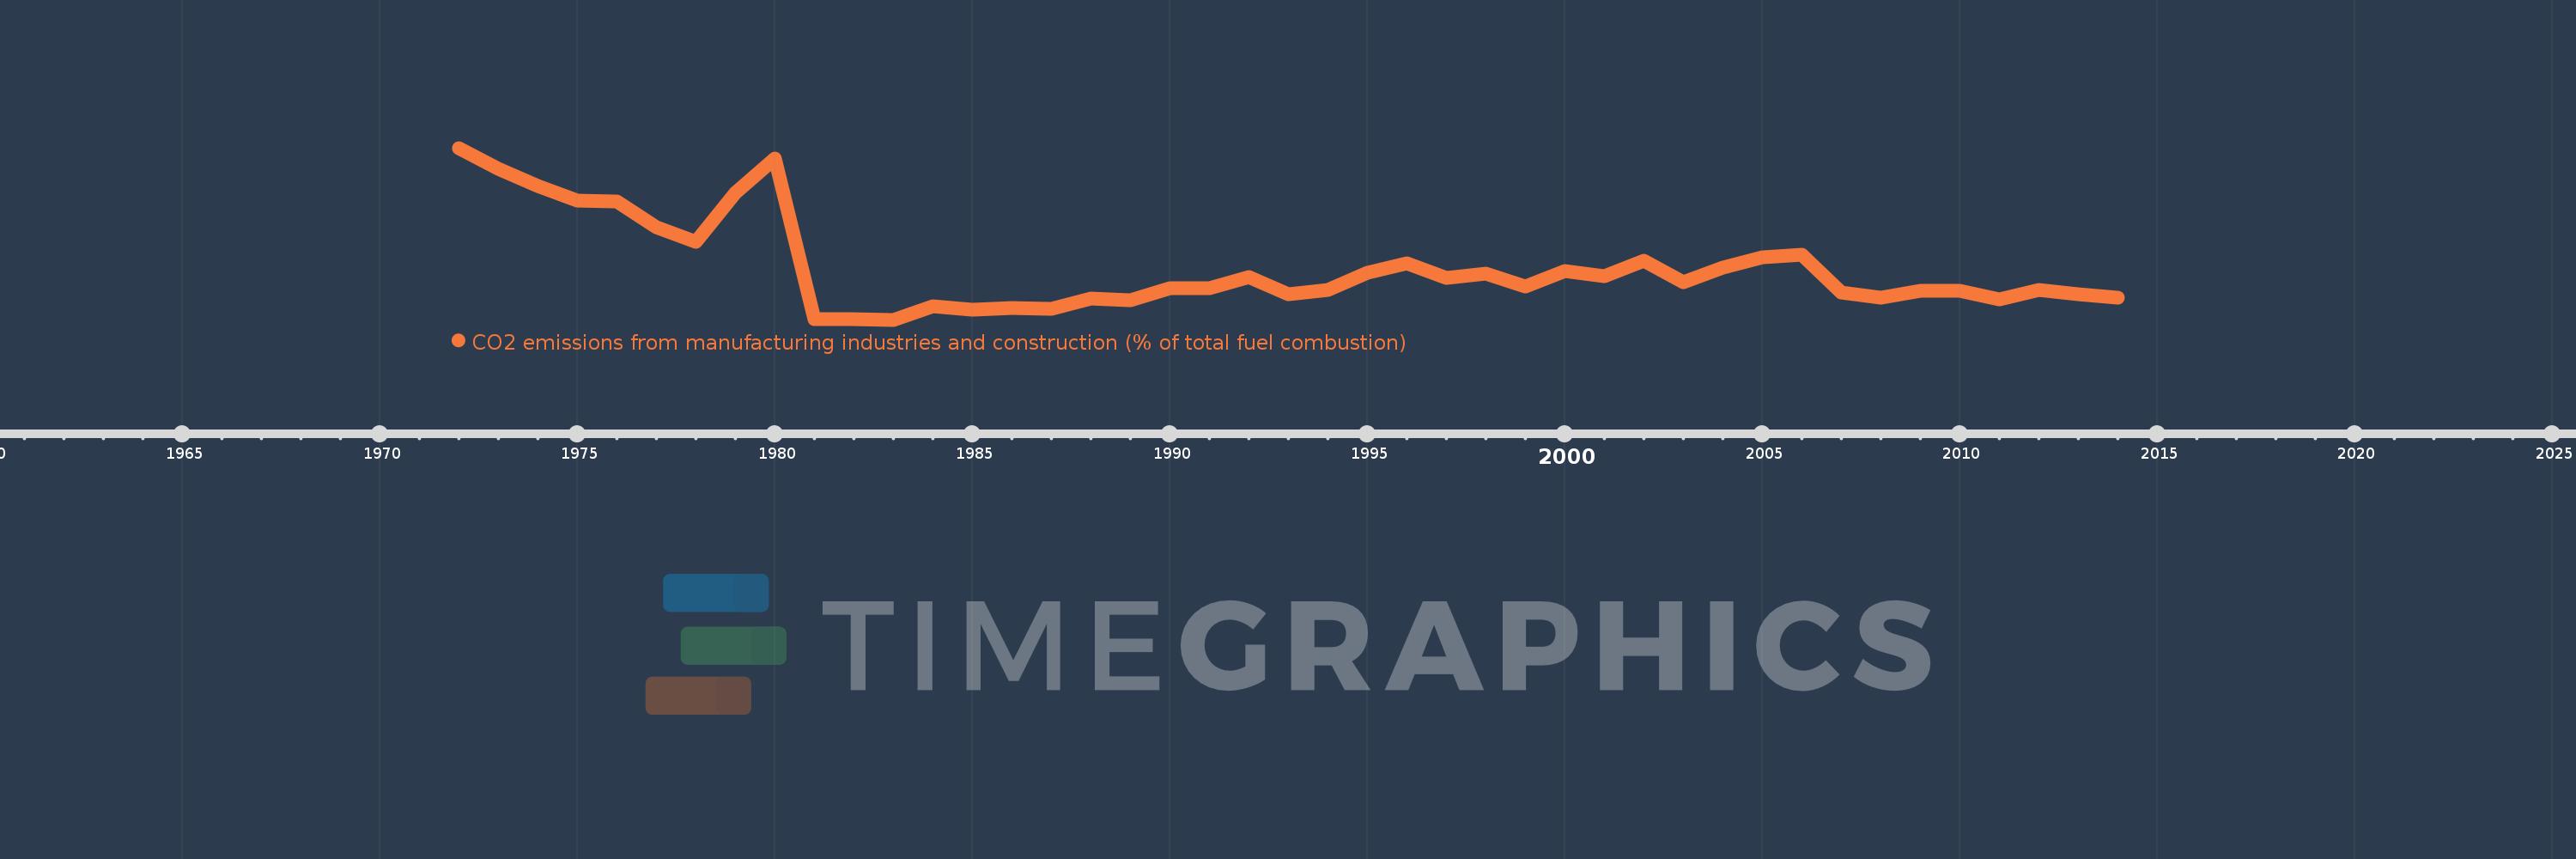
CO2 emissions from manufacturing industries and construction (% of total fuel combustion)
2014,2013,2012,2011,2010,2009,2008,2007,2006,2005,2004,2003,2002,2001,2000,1999,1998,1997,1996,1995,1994,1993,1992,1991,1990,1989,1988,1987,1986,1985,1984,1983,1982,1981,1980,1979,1978,1977,1976,1975,1974,1973,1972
Estas estatísticas em outros países:
AlbaniaAlgeriaAngolaArab WorldArgentinaArmeniaAustraliaAustriaAzerbaijanBahrainBangladeshBelarusBelgiumBeninBoliviaBosnia and HerzegovinaBotswanaBrazilBrunei DarussalamBulgariaCambodiaCameroonCanadaCaribbean small statesCentral Europe and the BalticsChileChinaColombiaCongo, Dem. Rep.Congo, Rep.Costa RicaCote d'IvoireCroatiaCubaCuracaoCyprusCzech RepublicDenmarkDominican RepublicEarly-demographic dividendEast Asia & PacificEast Asia & Pacific (excluding high income)East Asia & Pacific (IDA & IBRD countries)EcuadorEgypt, Arab Rep.El SalvadorEritreaEstoniaEthiopiaEuro areaEurope & Central AsiaEurope & Central Asia (excluding high income)Europe & Central Asia (IDA & IBRD countries)European UnionFinlandFragile and conflict affected situationsFranceGabonGeorgiaGermanyGhanaGibraltarGreeceGuatemalaHaitiHeavily indebted poor countries (HIPC)High incomeHondurasHong Kong SAR, ChinaHungaryIBRD onlyIcelandIDA & IBRD totalIDA blendIDA onlyIDA totalIndiaIndonesiaIran, Islamic Rep.IraqIrelandIsraelItalyJamaicaJapanJordanKazakhstanKenyaKorea, Dem. People’s Rep.Korea, Rep.KosovoKuwaitKyrgyz RepublicLate-demographic dividendLatin America & Caribbean Latin America & Caribbean (excluding high income)Latin America & the Caribbean (IDA & IBRD countries)LatviaLeast developed countries: UN classificationLebanonLibyaLithuaniaLow & middle incomeLow incomeLower middle incomeLuxembourgMacedonia, FYRMalaysiaMaltaMauritiusMexicoMiddle East & North AfricaMiddle East & North Africa (excluding high income)Middle East & North Africa (IDA & IBRD countries)Middle incomeMoldovaMongoliaMontenegroMoroccoMozambiqueMyanmarNamibiaNepalNetherlandsNew ZealandNicaraguaNigerNigeriaNorth AmericaNorwayOECD membersOmanOther small statesPakistanPanamaParaguayPeruPhilippinesPolandPortugalPost-demographic dividendPre-demographic dividendQatarRomaniaRussian FederationSaudi ArabiaSenegalSerbiaSingaporeSlovak RepublicSloveniaSmall statesSouth AfricaSouth AsiaSouth Asia (IDA & IBRD)South SudanSpainSri LankaSub-Saharan Africa Sub-Saharan Africa (excluding high income)Sub-Saharan Africa (IDA & IBRD countries)SudanSwedenSwitzerlandSyrian Arab RepublicTajikistanTanzaniaThailandTogoTrinidad and TobagoTunisiaTurkeyTurkmenistanUkraineUnited Arab EmiratesUnited KingdomUnited StatesUpper middle incomeUruguayUzbekistanVenezuela, RBVietnamWorldYemen, Rep.ZambiaZimbabwe Linha do tempo:
Nesta escala de tempo está apresentado um gráfico de 1972 ano até 2014 ano Lebanon. Dados de 1971 ano ausente. O número de observações reais por data: 43.
Fonte (nome):
Indicadores de desenvolvimento mundial
Fonte (organização):
IEA Statistics © OECD/IEA 2014 (http://www.iea.org/stats/index.asp), subject to https://www.iea.org/t&c/termsandconditions/
Categorias:
Environment
Foi atualizado:
23 abr 2017 ano
Indicadores de alterações dos valores ao longo dos anos
Mínimo:
0.214
1 jan 1983 ano
Máximo:
31.659
1 jan 1972 ano
Na data de observação
Valor
Mudança absoluta
A alteração em relação ao valor anterior
1 jan 1972 ano
31.659
+31.659
0.0%
1 jan 1973 ano
27.912
-3.748
-11.84%
1 jan 1974 ano
24.726
-3.186
-11.41%
1 jan 1975 ano
22.034
-2.692
-10.89%
1 jan 1976 ano
21.891
-0.142
-0.65%
1 jan 1977 ano
17.143
-4.749
-21.69%
1 jan 1978 ano
14.534
-2.609
-15.22%
1 jan 1979 ano
23.448
+8.915
61.34%
1 jan 1980 ano
29.683
+6.234
26.59%
1 jan 1981 ano
0.301
-29.382
-98.99%
1 jan 1982 ano
0.316
+0.015
5.06%
1 jan 1983 ano
0.214
-0.102
-32.37%
1 jan 1984 ano
2.697
+2.484
1.16 mil%
1 jan 1985 ano
2.018
-0.679
-25.18%
1 jan 1986 ano
2.421
+0.402
19.93%
1 jan 1987 ano
2.266
-0.154
-6.37%
1 jan 1988 ano
4.149
+1.883
83.09%
1 jan 1989 ano
3.839
-0.31
-7.48%
1 jan 1990 ano
5.989
+2.15
56.0%
1 jan 1991 ano
5.989
0.0
0.0%
1 jan 1992 ano
8.058
+2.068
34.54%
1 jan 1993 ano
4.928
-3.13
-38.85%
1 jan 1994 ano
5.644
+0.716
14.53%
1 jan 1995 ano
8.755
+3.111
55.12%
1 jan 1996 ano
10.555
+1.801
20.57%
1 jan 1997 ano
7.814
-2.741
-25.97%
1 jan 1998 ano
8.733
+0.919
11.76%
1 jan 1999 ano
6.321
-2.411
-27.61%
1 jan 2000 ano
9.137
+2.816
44.55%
1 jan 2001 ano
8.149
-0.989
-10.82%
1 jan 2002 ano
11.023
+2.874
35.27%
1 jan 2003 ano
7.02
-4.003
-36.32%
1 jan 2004 ano
9.767
+2.748
39.14%
1 jan 2005 ano
11.652
+1.885
19.3%
1 jan 2006 ano
12.102
+0.45
3.86%
1 jan 2007 ano
5.271
-6.831
-56.45%
1 jan 2008 ano
4.33
-0.941
-17.86%
1 jan 2009 ano
5.58
+1.25
28.88%
1 jan 2010 ano
5.449
-0.131
-2.35%
1 jan 2011 ano
4.011
-1.438
-26.39%
1 jan 2012 ano
5.73
+1.719
42.85%
1 jan 2013 ano
4.905
-0.825
-14.4%
1 jan 2014 ano
4.312
-0.593
-12.09%
Classificação de países por estatísticas atuais por anos


Comentários: