29
/pt/
pt
AIzaSyAYiBZKx7MnpbEhh9jyipgxe19OcubqV5w
April 1, 2024
261989
Thailand
THA
true
2
1
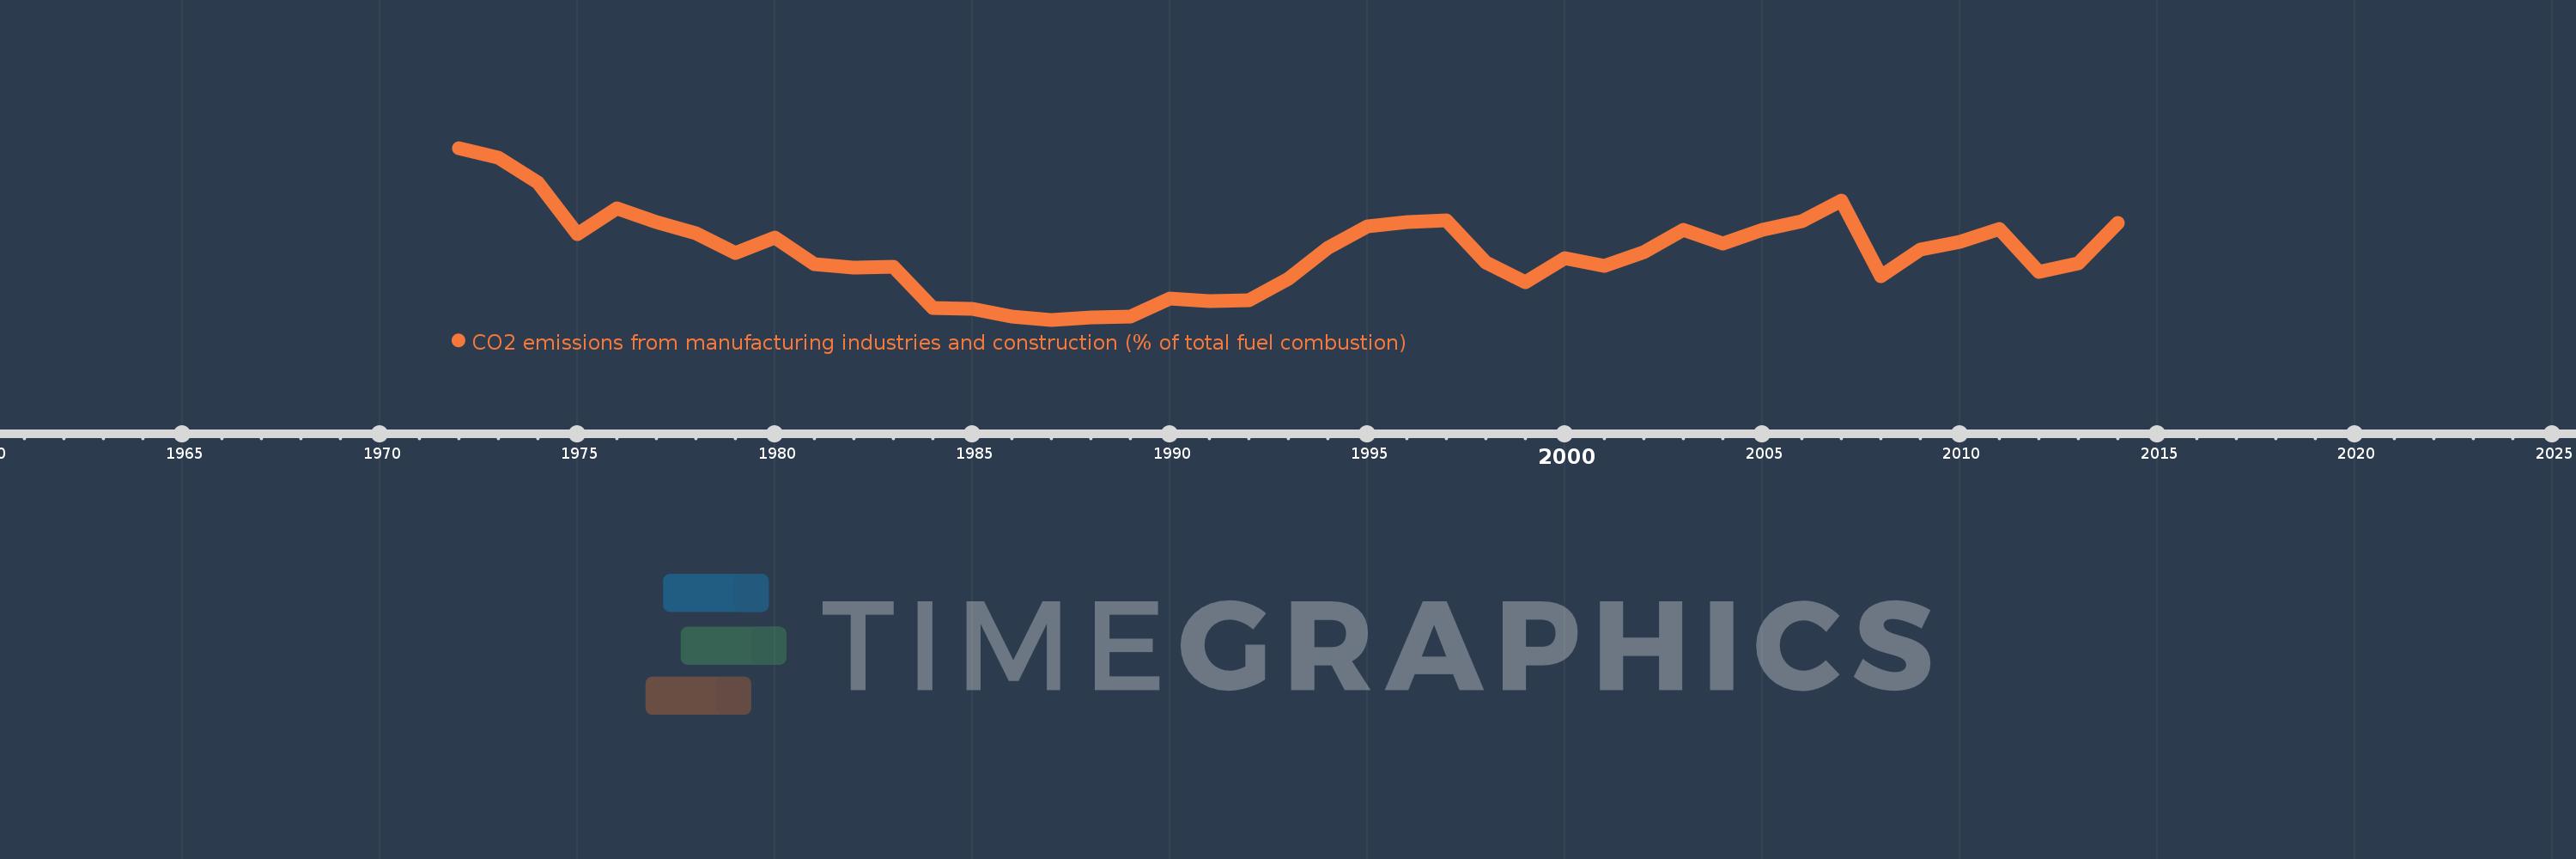
CO2 emissions from manufacturing industries and construction (% of total fuel combustion)
2014,2013,2012,2011,2010,2009,2008,2007,2006,2005,2004,2003,2002,2001,2000,1999,1998,1997,1996,1995,1994,1993,1992,1991,1990,1989,1988,1987,1986,1985,1984,1983,1982,1981,1980,1979,1978,1977,1976,1975,1974,1973,1972
Estas estatísticas em outros países:
AlbaniaAlgeriaAngolaArab WorldArgentinaArmeniaAustraliaAustriaAzerbaijanBahrainBangladeshBelarusBelgiumBeninBoliviaBosnia and HerzegovinaBotswanaBrazilBrunei DarussalamBulgariaCambodiaCameroonCanadaCaribbean small statesCentral Europe and the BalticsChileChinaColombiaCongo, Dem. Rep.Congo, Rep.Costa RicaCote d'IvoireCroatiaCubaCuracaoCyprusCzech RepublicDenmarkDominican RepublicEarly-demographic dividendEast Asia & PacificEast Asia & Pacific (excluding high income)East Asia & Pacific (IDA & IBRD countries)EcuadorEgypt, Arab Rep.El SalvadorEritreaEstoniaEthiopiaEuro areaEurope & Central AsiaEurope & Central Asia (excluding high income)Europe & Central Asia (IDA & IBRD countries)European UnionFinlandFragile and conflict affected situationsFranceGabonGeorgiaGermanyGhanaGibraltarGreeceGuatemalaHaitiHeavily indebted poor countries (HIPC)High incomeHondurasHong Kong SAR, ChinaHungaryIBRD onlyIcelandIDA & IBRD totalIDA blendIDA onlyIDA totalIndiaIndonesiaIran, Islamic Rep.IraqIrelandIsraelItalyJamaicaJapanJordanKazakhstanKenyaKorea, Dem. People’s Rep.Korea, Rep.KosovoKuwaitKyrgyz RepublicLate-demographic dividendLatin America & Caribbean Latin America & Caribbean (excluding high income)Latin America & the Caribbean (IDA & IBRD countries)LatviaLeast developed countries: UN classificationLebanonLibyaLithuaniaLow & middle incomeLow incomeLower middle incomeLuxembourgMacedonia, FYRMalaysiaMaltaMauritiusMexicoMiddle East & North AfricaMiddle East & North Africa (excluding high income)Middle East & North Africa (IDA & IBRD countries)Middle incomeMoldovaMongoliaMontenegroMoroccoMozambiqueMyanmarNamibiaNepalNetherlandsNew ZealandNicaraguaNigerNigeriaNorth AmericaNorwayOECD membersOmanOther small statesPakistanPanamaParaguayPeruPhilippinesPolandPortugalPost-demographic dividendPre-demographic dividendQatarRomaniaRussian FederationSaudi ArabiaSenegalSerbiaSingaporeSlovak RepublicSloveniaSmall statesSouth AfricaSouth AsiaSouth Asia (IDA & IBRD)South SudanSpainSri LankaSub-Saharan Africa Sub-Saharan Africa (excluding high income)Sub-Saharan Africa (IDA & IBRD countries)SudanSwedenSwitzerlandSyrian Arab RepublicTajikistanTanzaniaThailandTogoTrinidad and TobagoTunisiaTurkeyTurkmenistanUkraineUnited Arab EmiratesUnited KingdomUnited StatesUpper middle incomeUruguayUzbekistanVenezuela, RBVietnamWorldYemen, Rep.ZambiaZimbabwe Linha do tempo:
Nesta escala de tempo está apresentado um gráfico de 1972 ano até 2014 ano Thailand. Dados de 1971 ano ausente. O número de observações reais por data: 43.
Fonte (nome):
Indicadores de desenvolvimento mundial
Fonte (organização):
IEA Statistics © OECD/IEA 2014 (http://www.iea.org/stats/index.asp), subject to https://www.iea.org/t&c/termsandconditions/
Categorias:
Environment
Foi atualizado:
23 abr 2017 ano
Indicadores de alterações dos valores ao longo dos anos
Mínimo:
17.128
1 jan 1987 ano
Máximo:
27.032
1 jan 1972 ano
Na data de observação
Valor
Mudança absoluta
A alteração em relação ao valor anterior
1 jan 1972 ano
27.032
+27.032
0.0%
1 jan 1973 ano
26.492
-0.541
-2.0%
1 jan 1974 ano
25.06
-1.431
-5.4%
1 jan 1975 ano
22.045
-3.016
-12.03%
1 jan 1976 ano
23.557
+1.513
6.86%
1 jan 1977 ano
22.771
-0.787
-3.34%
1 jan 1978 ano
22.102
-0.669
-2.94%
1 jan 1979 ano
20.967
-1.135
-5.14%
1 jan 1980 ano
21.852
+0.885
4.22%
1 jan 1981 ano
20.338
-1.514
-6.93%
1 jan 1982 ano
20.123
-0.215
-1.06%
1 jan 1983 ano
20.18
+0.057
0.28%
1 jan 1984 ano
17.809
-2.371
-11.75%
1 jan 1985 ano
17.768
-0.041
-0.23%
1 jan 1986 ano
17.309
-0.459
-2.58%
1 jan 1987 ano
17.128
-0.181
-1.05%
1 jan 1988 ano
17.26
+0.132
0.77%
1 jan 1989 ano
17.317
+0.057
0.33%
1 jan 1990 ano
18.374
+1.057
6.1%
1 jan 1991 ano
18.222
-0.152
-0.83%
1 jan 1992 ano
18.251
+0.029
0.16%
1 jan 1993 ano
19.474
+1.223
6.7%
1 jan 1994 ano
21.254
+1.78
9.14%
1 jan 1995 ano
22.505
+1.25
5.88%
1 jan 1996 ano
22.751
+0.246
1.09%
1 jan 1997 ano
22.854
+0.103
0.45%
1 jan 1998 ano
20.419
-2.435
-10.65%
1 jan 1999 ano
19.269
-1.15
-5.63%
1 jan 2000 ano
20.681
+1.413
7.33%
1 jan 2001 ano
20.231
-0.45
-2.18%
1 jan 2002 ano
21.038
+0.806
3.99%
1 jan 2003 ano
22.313
+1.275
6.06%
1 jan 2004 ano
21.54
-0.772
-3.46%
1 jan 2005 ano
22.311
+0.77
3.58%
1 jan 2006 ano
22.802
+0.492
2.2%
1 jan 2007 ano
24.0
+1.197
5.25%
1 jan 2008 ano
19.662
-4.338
-18.07%
1 jan 2009 ano
21.16
+1.498
7.62%
1 jan 2010 ano
21.607
+0.447
2.11%
1 jan 2011 ano
22.354
+0.746
3.45%
1 jan 2012 ano
19.907
-2.446
-10.94%
1 jan 2013 ano
20.376
+0.469
2.35%
1 jan 2014 ano
22.691
+2.316
11.36%
Classificação de países por estatísticas atuais por anos


Comentários: