29
/pt/
pt
AIzaSyAYiBZKx7MnpbEhh9jyipgxe19OcubqV5w
April 1, 2024
55379
Pre-demographic dividend
PRE
false
2
1
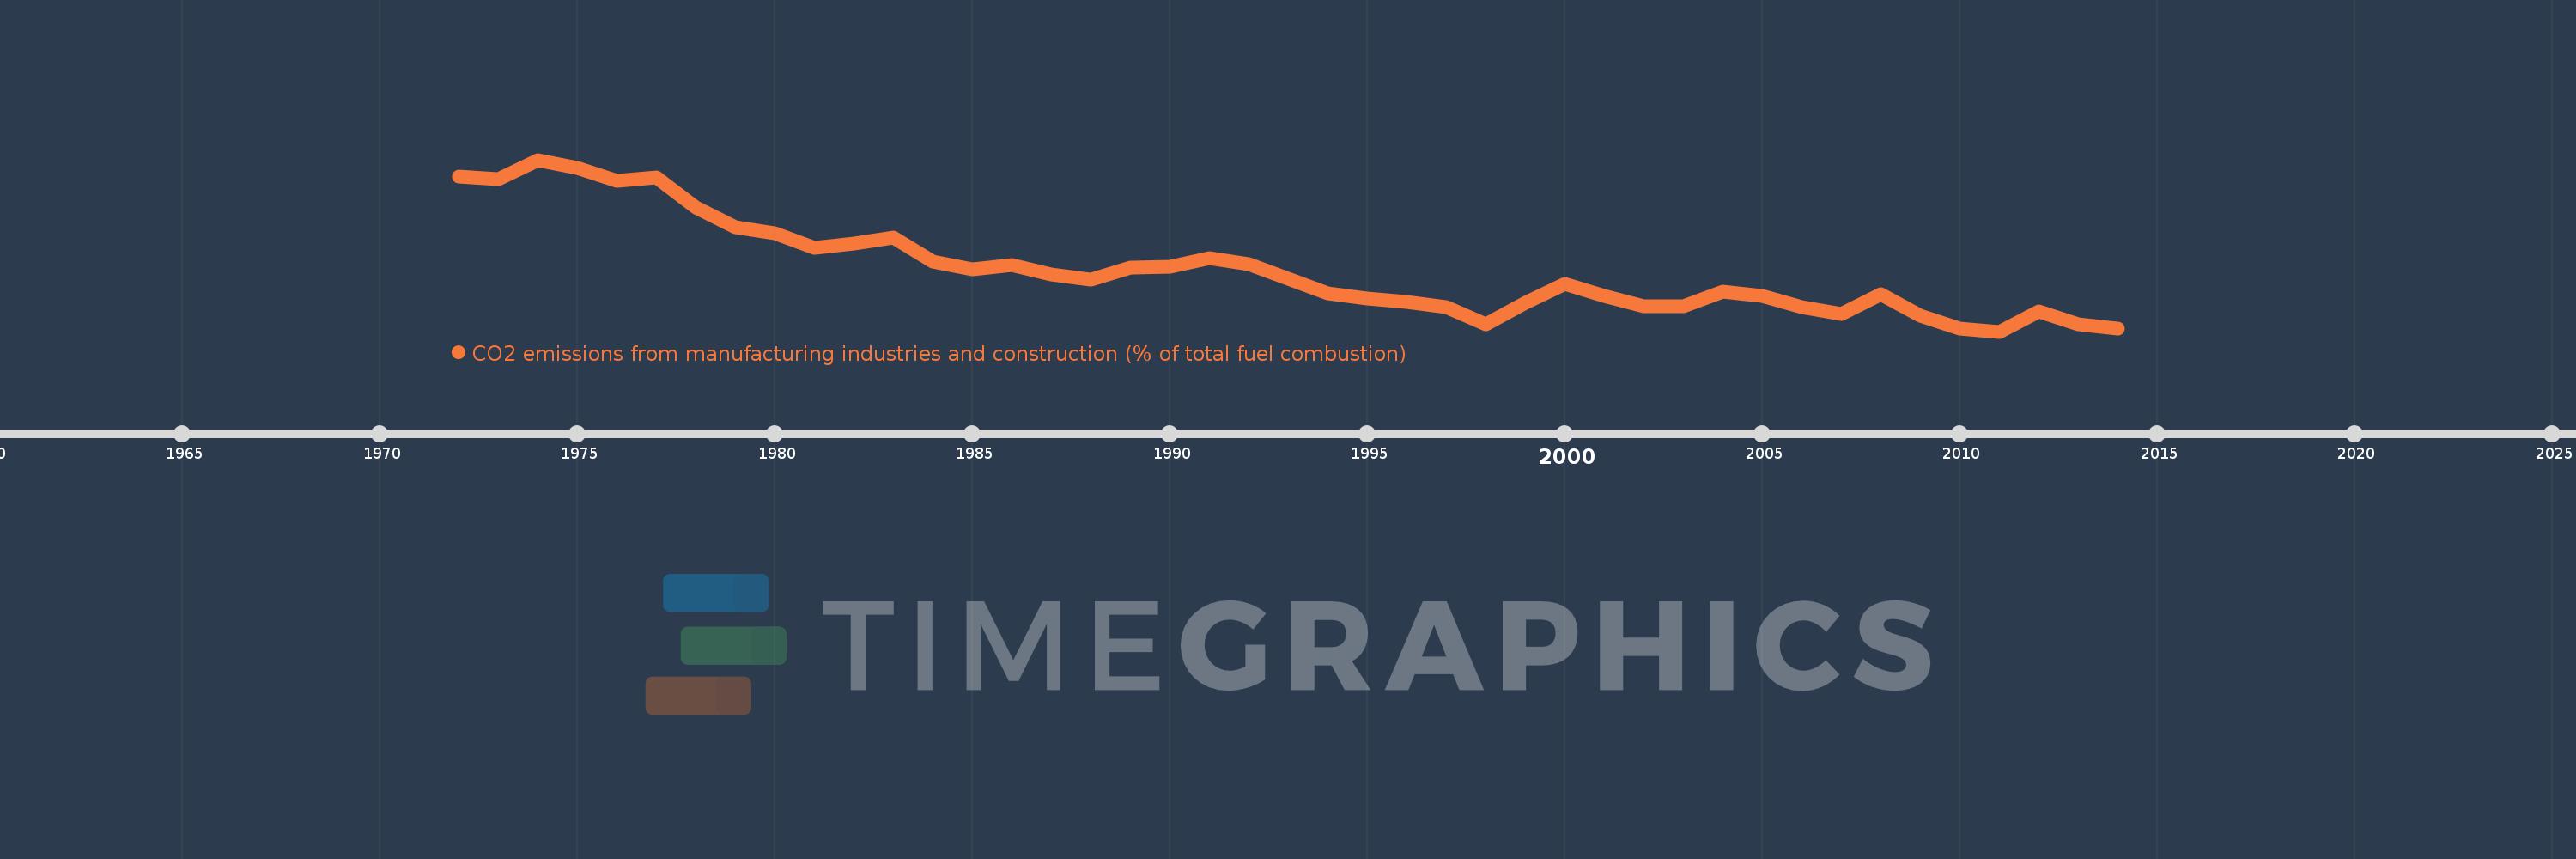
CO2 emissions from manufacturing industries and construction (% of total fuel combustion)
2014,2013,2012,2011,2010,2009,2008,2007,2006,2005,2004,2003,2002,2001,2000,1999,1998,1997,1996,1995,1994,1993,1992,1991,1990,1989,1988,1987,1986,1985,1984,1983,1982,1981,1980,1979,1978,1977,1976,1975,1974,1973,1972
Estas estatísticas em outros países:
AlbaniaAlgeriaAngolaArab WorldArgentinaArmeniaAustraliaAustriaAzerbaijanBahrainBangladeshBelarusBelgiumBeninBoliviaBosnia and HerzegovinaBotswanaBrazilBrunei DarussalamBulgariaCambodiaCameroonCanadaCaribbean small statesCentral Europe and the BalticsChileChinaColombiaCongo, Dem. Rep.Congo, Rep.Costa RicaCote d'IvoireCroatiaCubaCuracaoCyprusCzech RepublicDenmarkDominican RepublicEarly-demographic dividendEast Asia & PacificEast Asia & Pacific (excluding high income)East Asia & Pacific (IDA & IBRD countries)EcuadorEgypt, Arab Rep.El SalvadorEritreaEstoniaEthiopiaEuro areaEurope & Central AsiaEurope & Central Asia (excluding high income)Europe & Central Asia (IDA & IBRD countries)European UnionFinlandFragile and conflict affected situationsFranceGabonGeorgiaGermanyGhanaGibraltarGreeceGuatemalaHaitiHeavily indebted poor countries (HIPC)High incomeHondurasHong Kong SAR, ChinaHungaryIBRD onlyIcelandIDA & IBRD totalIDA blendIDA onlyIDA totalIndiaIndonesiaIran, Islamic Rep.IraqIrelandIsraelItalyJamaicaJapanJordanKazakhstanKenyaKorea, Dem. People’s Rep.Korea, Rep.KosovoKuwaitKyrgyz RepublicLate-demographic dividendLatin America & Caribbean Latin America & Caribbean (excluding high income)Latin America & the Caribbean (IDA & IBRD countries)LatviaLeast developed countries: UN classificationLebanonLibyaLithuaniaLow & middle incomeLow incomeLower middle incomeLuxembourgMacedonia, FYRMalaysiaMaltaMauritiusMexicoMiddle East & North AfricaMiddle East & North Africa (excluding high income)Middle East & North Africa (IDA & IBRD countries)Middle incomeMoldovaMongoliaMontenegroMoroccoMozambiqueMyanmarNamibiaNepalNetherlandsNew ZealandNicaraguaNigerNigeriaNorth AmericaNorwayOECD membersOmanOther small statesPakistanPanamaParaguayPeruPhilippinesPolandPortugalPost-demographic dividendPre-demographic dividendQatarRomaniaRussian FederationSaudi ArabiaSenegalSerbiaSingaporeSlovak RepublicSloveniaSmall statesSouth AfricaSouth AsiaSouth Asia (IDA & IBRD)South SudanSpainSri LankaSub-Saharan Africa Sub-Saharan Africa (excluding high income)Sub-Saharan Africa (IDA & IBRD countries)SudanSwedenSwitzerlandSyrian Arab RepublicTajikistanTanzaniaThailandTogoTrinidad and TobagoTunisiaTurkeyTurkmenistanUkraineUnited Arab EmiratesUnited KingdomUnited StatesUpper middle incomeUruguayUzbekistanVenezuela, RBVietnamWorldYemen, Rep.ZambiaZimbabwe Linha do tempo:
Nesta escala de tempo está apresentado um gráfico de 1972 ano até 2014 ano Pre-demographic dividend. Dados de 1971 ano ausente. O número de observações reais por data: 43.
Fonte (nome):
Indicadores de desenvolvimento mundial
Fonte (organização):
IEA Statistics © OECD/IEA 2014 (http://www.iea.org/stats/index.asp), subject to https://www.iea.org/t&c/termsandconditions/
Categorias:
Environment
Foi atualizado:
23 abr 2017 ano
Indicadores de alterações dos valores ao longo dos anos
Mínimo:
9.527
1 jan 2011 ano
Máximo:
26.42
1 jan 1974 ano
Na data de observação
Valor
Mudança absoluta
A alteração em relação ao valor anterior
1 jan 1972 ano
24.756
+24.756
0.0%
1 jan 1973 ano
24.526
-0.23
-0.93%
1 jan 1974 ano
26.42
+1.894
7.72%
1 jan 1975 ano
25.658
-0.763
-2.89%
1 jan 1976 ano
24.337
-1.321
-5.15%
1 jan 1977 ano
24.701
+0.365
1.5%
1 jan 1978 ano
21.757
-2.945
-11.92%
1 jan 1979 ano
19.771
-1.986
-9.13%
1 jan 1980 ano
19.222
-0.549
-2.78%
1 jan 1981 ano
17.784
-1.438
-7.48%
1 jan 1982 ano
18.188
+0.405
2.28%
1 jan 1983 ano
18.744
+0.556
3.06%
1 jan 1984 ano
16.431
-2.313
-12.34%
1 jan 1985 ano
15.62
-0.811
-4.94%
1 jan 1986 ano
16.094
+0.474
3.03%
1 jan 1987 ano
15.111
-0.983
-6.11%
1 jan 1988 ano
14.595
-0.516
-3.41%
1 jan 1989 ano
15.848
+1.252
8.58%
1 jan 1990 ano
15.906
+0.059
0.37%
1 jan 1991 ano
16.736
+0.829
5.21%
1 jan 1992 ano
16.119
-0.616
-3.68%
1 jan 1993 ano
14.741
-1.378
-8.55%
1 jan 1994 ano
13.29
-1.452
-9.85%
1 jan 1995 ano
12.793
-0.496
-3.73%
1 jan 1996 ano
12.439
-0.354
-2.77%
1 jan 1997 ano
11.961
-0.479
-3.85%
1 jan 1998 ano
10.255
-1.706
-14.26%
1 jan 1999 ano
12.385
+2.131
20.78%
1 jan 2000 ano
14.244
+1.858
15.0%
1 jan 2001 ano
13.045
-1.199
-8.42%
1 jan 2002 ano
12.047
-0.998
-7.65%
1 jan 2003 ano
12.029
-0.018
-0.15%
1 jan 2004 ano
13.454
+1.425
11.85%
1 jan 2005 ano
13.067
-0.387
-2.88%
1 jan 2006 ano
11.944
-1.123
-8.59%
1 jan 2007 ano
11.222
-0.722
-6.05%
1 jan 2008 ano
13.188
+1.966
17.52%
1 jan 2009 ano
11.096
-2.092
-15.86%
1 jan 2010 ano
9.809
-1.286
-11.59%
1 jan 2011 ano
9.527
-0.282
-2.87%
1 jan 2012 ano
11.491
+1.964
20.61%
1 jan 2013 ano
10.259
-1.232
-10.72%
1 jan 2014 ano
9.853
-0.406
-3.96%
Classificação de países por estatísticas atuais por anos


Comentários: