29
/it/
it
AIzaSyAYiBZKx7MnpbEhh9jyipgxe19OcubqV5w
April 1, 2024
242393
Slovenia
SVN
true
2
1
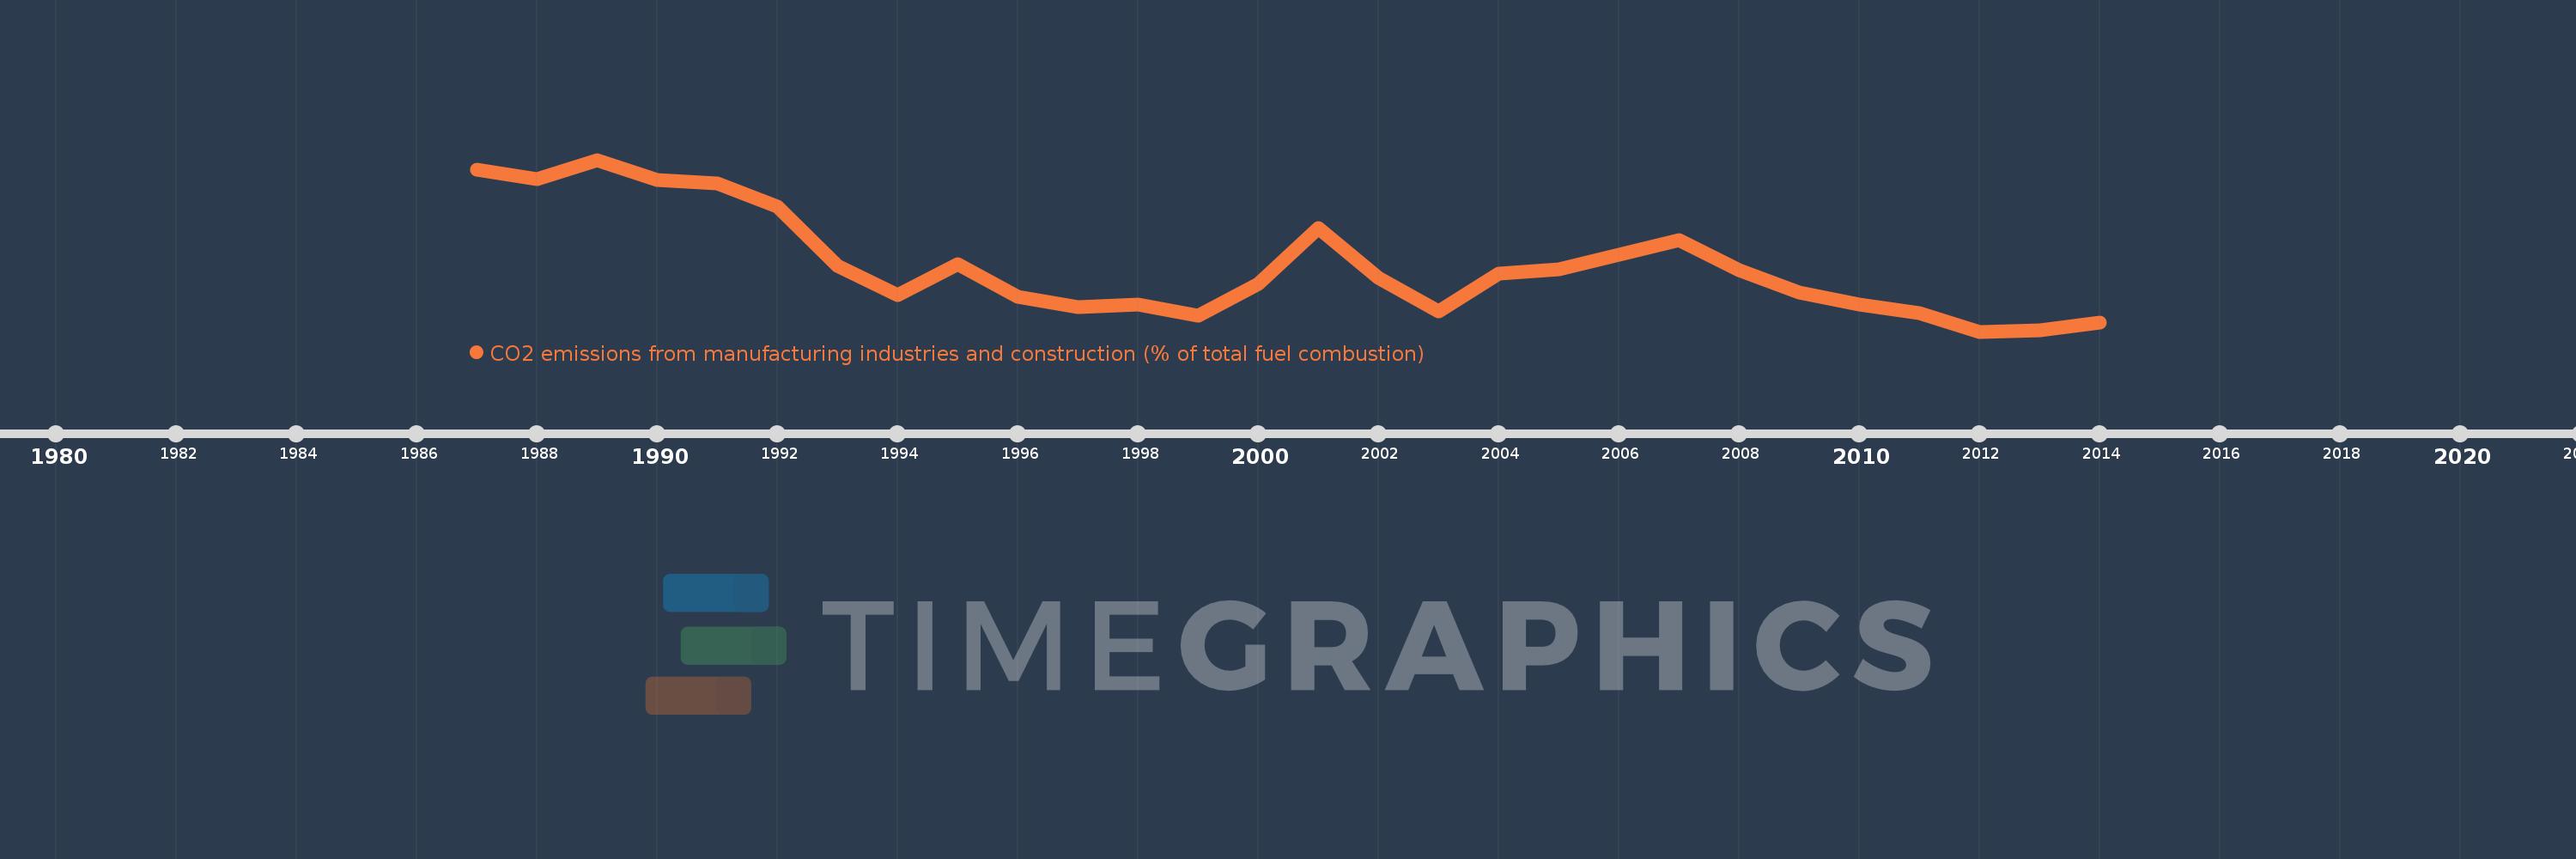
CO2 emissions from manufacturing industries and construction (% of total fuel combustion)
2014,2013,2012,2011,2010,2009,2008,2007,2006,2005,2004,2003,2002,2001,2000,1999,1998,1997,1996,1995,1994,1993,1992,1991,1990,1989,1988,1987
Queste statistiche in altri paesi:
AlbaniaAlgeriaAngolaArab WorldArgentinaArmeniaAustraliaAustriaAzerbaijanBahrainBangladeshBelarusBelgiumBeninBoliviaBosnia and HerzegovinaBotswanaBrazilBrunei DarussalamBulgariaCambodiaCameroonCanadaCaribbean small statesCentral Europe and the BalticsChileChinaColombiaCongo, Dem. Rep.Congo, Rep.Costa RicaCote d'IvoireCroatiaCubaCuracaoCyprusCzech RepublicDenmarkDominican RepublicEarly-demographic dividendEast Asia & PacificEast Asia & Pacific (excluding high income)East Asia & Pacific (IDA & IBRD countries)EcuadorEgypt, Arab Rep.El SalvadorEritreaEstoniaEthiopiaEuro areaEurope & Central AsiaEurope & Central Asia (excluding high income)Europe & Central Asia (IDA & IBRD countries)European UnionFinlandFragile and conflict affected situationsFranceGabonGeorgiaGermanyGhanaGibraltarGreeceGuatemalaHaitiHeavily indebted poor countries (HIPC)High incomeHondurasHong Kong SAR, ChinaHungaryIBRD onlyIcelandIDA & IBRD totalIDA blendIDA onlyIDA totalIndiaIndonesiaIran, Islamic Rep.IraqIrelandIsraelItalyJamaicaJapanJordanKazakhstanKenyaKorea, Dem. People’s Rep.Korea, Rep.KosovoKuwaitKyrgyz RepublicLate-demographic dividendLatin America & Caribbean Latin America & Caribbean (excluding high income)Latin America & the Caribbean (IDA & IBRD countries)LatviaLeast developed countries: UN classificationLebanonLibyaLithuaniaLow & middle incomeLow incomeLower middle incomeLuxembourgMacedonia, FYRMalaysiaMaltaMauritiusMexicoMiddle East & North AfricaMiddle East & North Africa (excluding high income)Middle East & North Africa (IDA & IBRD countries)Middle incomeMoldovaMongoliaMontenegroMoroccoMozambiqueMyanmarNamibiaNepalNetherlandsNew ZealandNicaraguaNigerNigeriaNorth AmericaNorwayOECD membersOmanOther small statesPakistanPanamaParaguayPeruPhilippinesPolandPortugalPost-demographic dividendPre-demographic dividendQatarRomaniaRussian FederationSaudi ArabiaSenegalSerbiaSingaporeSlovak RepublicSloveniaSmall statesSouth AfricaSouth AsiaSouth Asia (IDA & IBRD)South SudanSpainSri LankaSub-Saharan Africa Sub-Saharan Africa (excluding high income)Sub-Saharan Africa (IDA & IBRD countries)SudanSwedenSwitzerlandSyrian Arab RepublicTajikistanTanzaniaThailandTogoTrinidad and TobagoTunisiaTurkeyTurkmenistanUkraineUnited Arab EmiratesUnited KingdomUnited StatesUpper middle incomeUruguayUzbekistanVenezuela, RBVietnamWorldYemen, Rep.ZambiaZimbabwe Linea del tempo:
Questa scala temporale mostra un grafico dal 1987 anno al 2014 anno. Slovenia. I dati fino ad 1986 anno non disponibili. Il numero di osservazioni attuali secondo i date: 28.
La fonte (nome):
Indicatori dello sviluppo mondiale
La fonte (organizzazione):
IEA Statistics © OECD/IEA 2014 (http://www.iea.org/stats/index.asp), subject to https://www.iea.org/t&c/termsandconditions/
Categorie:
Environment
sono stati aggiornati
23 apr 2017 anni
Indicatori delle variazioni dei valori per anni
Minima:
11.147
1 gen 2012 anni
Massimo:
20.633
1 gen 1989 anni
Alla data di osservazione
Valore
Variazione assoluta
La variazione rispetto al valore precedente
1 gen 1987 anni
20.109
+20.109
0.0%
1 gen 1988 anni
19.574
-0.535
-2.66%
1 gen 1989 anni
20.633
+1.058
5.41%
1 gen 1990 anni
19.51
-1.122
-5.44%
1 gen 1991 anni
19.35
-0.16
-0.82%
1 gen 1992 anni
18.039
-1.311
-6.77%
1 gen 1993 anni
14.779
-3.26
-18.07%
1 gen 1994 anni
13.178
-1.601
-10.84%
1 gen 1995 anni
14.89
+1.713
13.0%
1 gen 1996 anni
13.077
-1.813
-12.18%
1 gen 1997 anni
12.517
-0.561
-4.29%
1 gen 1998 anni
12.623
+0.106
0.85%
1 gen 1999 anni
12.027
-0.596
-4.72%
1 gen 2000 anni
13.772
+1.745
14.51%
1 gen 2001 anni
16.856
+3.085
22.4%
1 gen 2002 anni
14.113
-2.743
-16.28%
1 gen 2003 anni
12.26
-1.853
-13.13%
1 gen 2004 anni
14.362
+2.102
17.15%
1 gen 2005 anni
14.567
+0.205
1.43%
1 gen 2006 anni
15.405
+0.838
5.75%
1 gen 2007 anni
16.192
+0.788
5.11%
1 gen 2008 anni
14.558
-1.634
-10.09%
1 gen 2009 anni
13.313
-1.245
-8.55%
1 gen 2010 anni
12.641
-0.672
-5.05%
1 gen 2011 anni
12.168
-0.473
-3.74%
1 gen 2012 anni
11.147
-1.021
-8.39%
1 gen 2013 anni
11.231
+0.084
0.75%
1 gen 2014 anni
11.646
+0.415
3.7%
Classificazione dei paesi secondo i statistiche attuali per anni


Commenti: