29
/it/
it
AIzaSyAYiBZKx7MnpbEhh9jyipgxe19OcubqV5w
April 1, 2024
36416
IBRD only
IBD
false
2
1
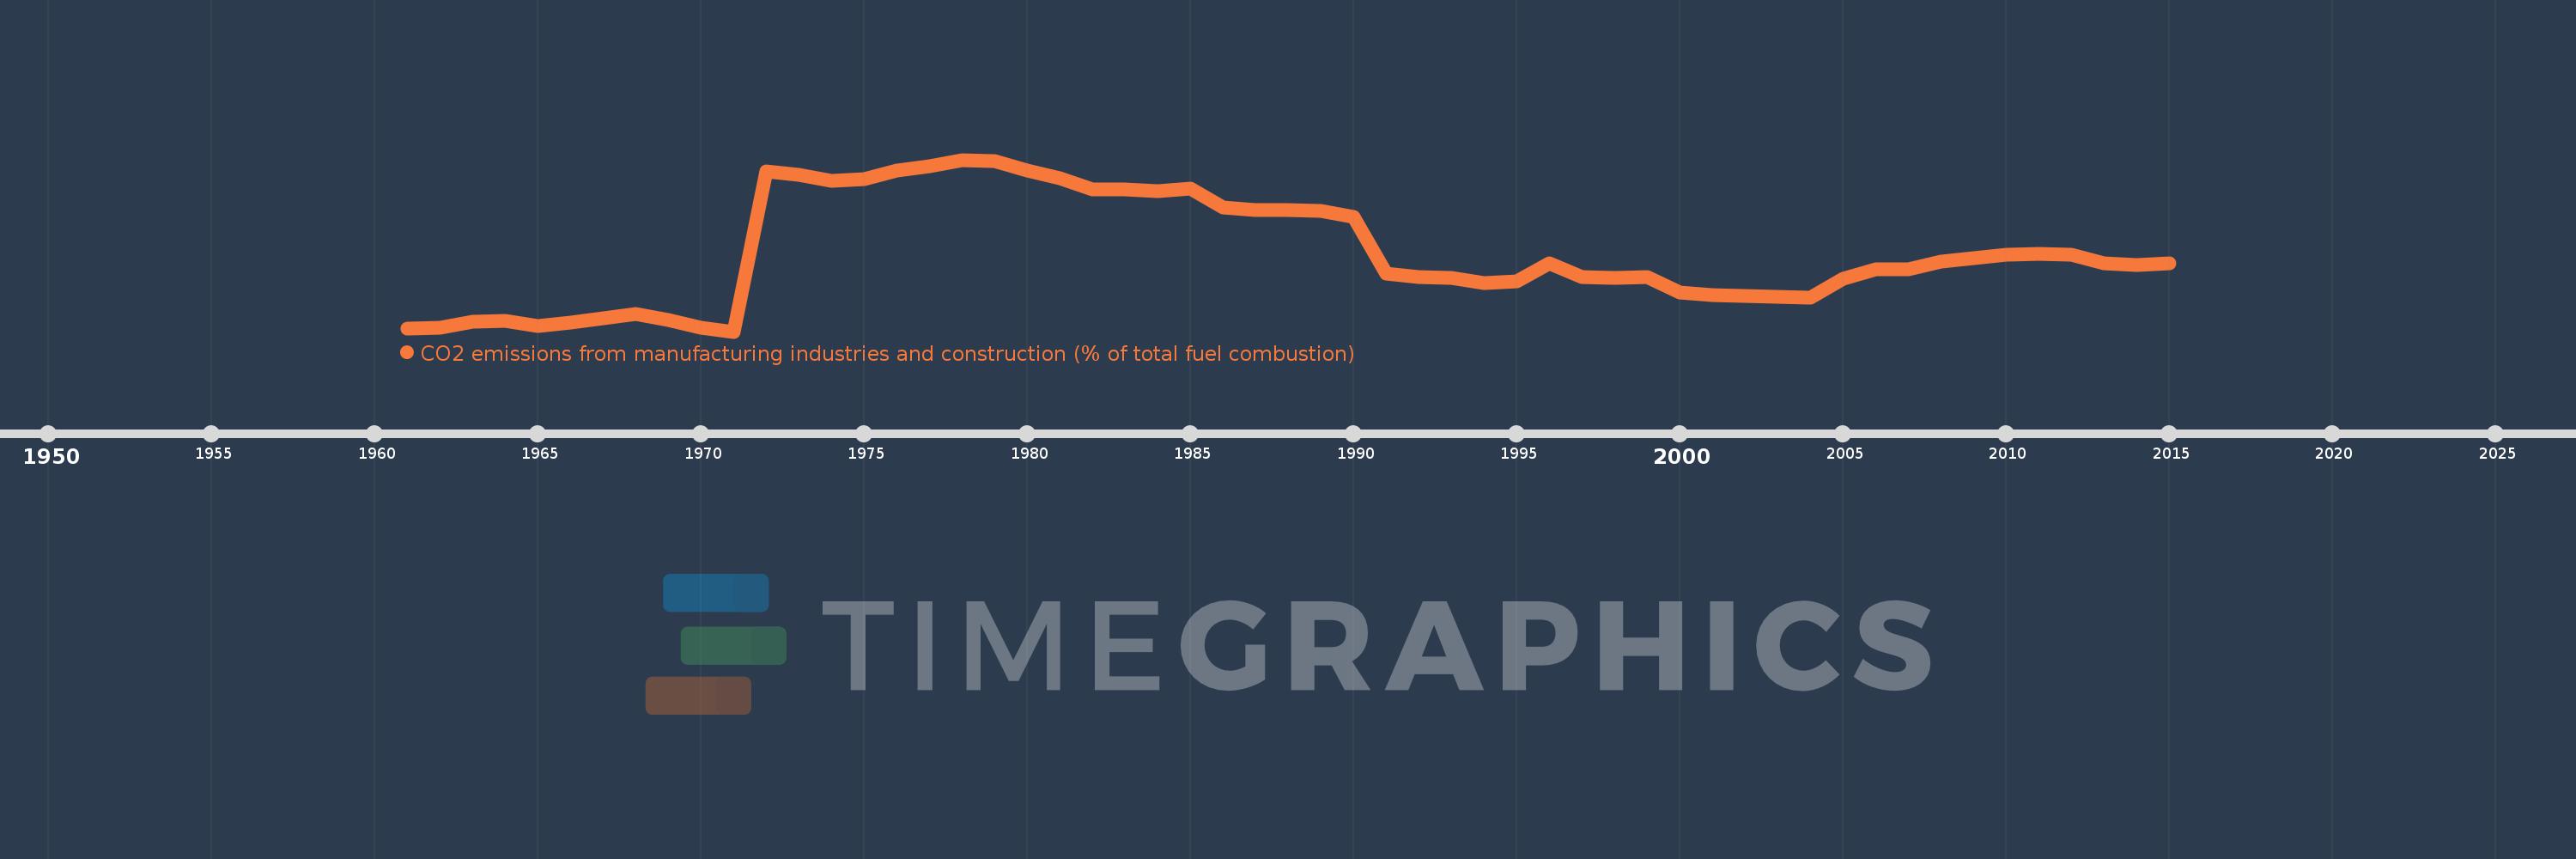
CO2 emissions from manufacturing industries and construction (% of total fuel combustion)
2015,2014,2013,2012,2011,2010,2009,2008,2007,2006,2005,2004,2003,2002,2001,2000,1999,1998,1997,1996,1995,1994,1993,1992,1991,1990,1989,1988,1987,1986,1985,1984,1983,1982,1981,1980,1979,1978,1977,1976,1975,1974,1973,1972,1971,1970,1969,1968,1967,1966,1965,1964,1963,1962,1961
Queste statistiche in altri paesi:
AlbaniaAlgeriaAngolaArab WorldArgentinaArmeniaAustraliaAustriaAzerbaijanBahrainBangladeshBelarusBelgiumBeninBoliviaBosnia and HerzegovinaBotswanaBrazilBrunei DarussalamBulgariaCambodiaCameroonCanadaCaribbean small statesCentral Europe and the BalticsChileChinaColombiaCongo, Dem. Rep.Congo, Rep.Costa RicaCote d'IvoireCroatiaCubaCuracaoCyprusCzech RepublicDenmarkDominican RepublicEarly-demographic dividendEast Asia & PacificEast Asia & Pacific (excluding high income)East Asia & Pacific (IDA & IBRD countries)EcuadorEgypt, Arab Rep.El SalvadorEritreaEstoniaEthiopiaEuro areaEurope & Central AsiaEurope & Central Asia (excluding high income)Europe & Central Asia (IDA & IBRD countries)European UnionFinlandFragile and conflict affected situationsFranceGabonGeorgiaGermanyGhanaGibraltarGreeceGuatemalaHaitiHeavily indebted poor countries (HIPC)High incomeHondurasHong Kong SAR, ChinaHungaryIBRD onlyIcelandIDA & IBRD totalIDA blendIDA onlyIDA totalIndiaIndonesiaIran, Islamic Rep.IraqIrelandIsraelItalyJamaicaJapanJordanKazakhstanKenyaKorea, Dem. People’s Rep.Korea, Rep.KosovoKuwaitKyrgyz RepublicLate-demographic dividendLatin America & Caribbean Latin America & Caribbean (excluding high income)Latin America & the Caribbean (IDA & IBRD countries)LatviaLeast developed countries: UN classificationLebanonLibyaLithuaniaLow & middle incomeLow incomeLower middle incomeLuxembourgMacedonia, FYRMalaysiaMaltaMauritiusMexicoMiddle East & North AfricaMiddle East & North Africa (excluding high income)Middle East & North Africa (IDA & IBRD countries)Middle incomeMoldovaMongoliaMontenegroMoroccoMozambiqueMyanmarNamibiaNepalNetherlandsNew ZealandNicaraguaNigerNigeriaNorth AmericaNorwayOECD membersOmanOther small statesPakistanPanamaParaguayPeruPhilippinesPolandPortugalPost-demographic dividendPre-demographic dividendQatarRomaniaRussian FederationSaudi ArabiaSenegalSerbiaSingaporeSlovak RepublicSloveniaSmall statesSouth AfricaSouth AsiaSouth Asia (IDA & IBRD)South SudanSpainSri LankaSub-Saharan Africa Sub-Saharan Africa (excluding high income)Sub-Saharan Africa (IDA & IBRD countries)SudanSwedenSwitzerlandSyrian Arab RepublicTajikistanTanzaniaThailandTogoTrinidad and TobagoTunisiaTurkeyTurkmenistanUkraineUnited Arab EmiratesUnited KingdomUnited StatesUpper middle incomeUruguayUzbekistanVenezuela, RBVietnamWorldYemen, Rep.ZambiaZimbabwe Linea del tempo:
Questa scala temporale mostra un grafico dal 1961 anno al 2015 anno. IBRD only. I dati fino ad 1960 anno non disponibili. Il numero di osservazioni attuali secondo i date: 55.
La fonte (nome):
Indicatori dello sviluppo mondiale
La fonte (organizzazione):
IEA Statistics © OECD/IEA 2014 (http://www.iea.org/stats/index.asp), subject to https://www.iea.org/t&c/termsandconditions/
Categorie:
Environment
sono stati aggiornati
23 apr 2017 anni
Indicatori delle variazioni dei valori per anni
Minima:
17.751
1 gen 1971 anni
Massimo:
35.03
1 gen 1978 anni
Alla data di osservazione
Valore
Variazione assoluta
La variazione rispetto al valore precedente
1 gen 1961 anni
18.013
+18.013
0.0%
1 gen 1962 anni
18.119
+0.106
0.59%
1 gen 1963 anni
18.717
+0.598
3.3%
1 gen 1964 anni
18.8
+0.083
0.44%
1 gen 1965 anni
18.348
-0.453
-2.41%
1 gen 1966 anni
18.686
+0.338
1.84%
1 gen 1967 anni
19.081
+0.395
2.12%
1 gen 1968 anni
19.518
+0.438
2.29%
1 gen 1969 anni
18.906
-0.613
-3.14%
1 gen 1970 anni
18.172
-0.734
-3.88%
1 gen 1971 anni
17.751
-0.421
-2.32%
1 gen 1972 anni
33.906
+16.155
91.01%
1 gen 1973 anni
33.528
-0.377
-1.11%
1 gen 1974 anni
32.909
-0.619
-1.85%
1 gen 1975 anni
33.051
+0.142
0.43%
1 gen 1976 anni
33.932
+0.881
2.67%
1 gen 1977 anni
34.416
+0.484
1.43%
1 gen 1978 anni
35.03
+0.615
1.79%
1 gen 1979 anni
34.897
-0.133
-0.38%
1 gen 1980 anni
33.922
-0.975
-2.79%
1 gen 1981 anni
33.148
-0.774
-2.28%
1 gen 1982 anni
32.088
-1.06
-3.2%
1 gen 1983 anni
32.068
-0.02
-0.06%
1 gen 1984 anni
31.834
-0.233
-0.73%
1 gen 1985 anni
32.131
+0.297
0.93%
1 gen 1986 anni
30.223
-1.909
-5.94%
1 gen 1987 anni
29.95
-0.272
-0.9%
1 gen 1988 anni
29.998
+0.047
0.16%
1 gen 1989 anni
29.887
-0.111
-0.37%
1 gen 1990 anni
29.304
-0.583
-1.95%
1 gen 1991 anni
23.625
-5.679
-19.38%
1 gen 1992 anni
23.262
-0.363
-1.54%
1 gen 1993 anni
23.146
-0.115
-0.5%
1 gen 1994 anni
22.61
-0.536
-2.32%
1 gen 1995 anni
22.788
+0.178
0.79%
1 gen 1996 anni
24.638
+1.851
8.12%
1 gen 1997 anni
23.226
-1.413
-5.73%
1 gen 1998 anni
23.173
-0.052
-0.22%
1 gen 1999 anni
23.259
+0.086
0.37%
1 gen 2000 anni
21.646
-1.612
-6.93%
1 gen 2001 anni
21.435
-0.211
-0.98%
1 gen 2002 anni
21.326
-0.109
-0.51%
1 gen 2003 anni
21.248
-0.078
-0.37%
1 gen 2004 anni
21.136
-0.112
-0.53%
1 gen 2005 anni
23.069
+1.932
9.14%
1 gen 2006 anni
23.998
+0.929
4.03%
1 gen 2007 anni
23.978
-0.02
-0.08%
1 gen 2008 anni
24.762
+0.785
3.27%
1 gen 2009 anni
25.152
+0.39
1.57%
1 gen 2010 anni
25.465
+0.313
1.24%
1 gen 2011 anni
25.549
+0.085
0.33%
1 gen 2012 anni
25.519
-0.031
-0.12%
1 gen 2013 anni
24.622
-0.897
-3.52%
1 gen 2014 anni
24.455
-0.167
-0.68%
1 gen 2015 anni
24.645
+0.19
0.78%
Classificazione dei paesi secondo i statistiche attuali per anni


Commenti: