29
/pt/
pt
AIzaSyAYiBZKx7MnpbEhh9jyipgxe19OcubqV5w
April 1, 2024
108408
Comoros
COM
true
2
1
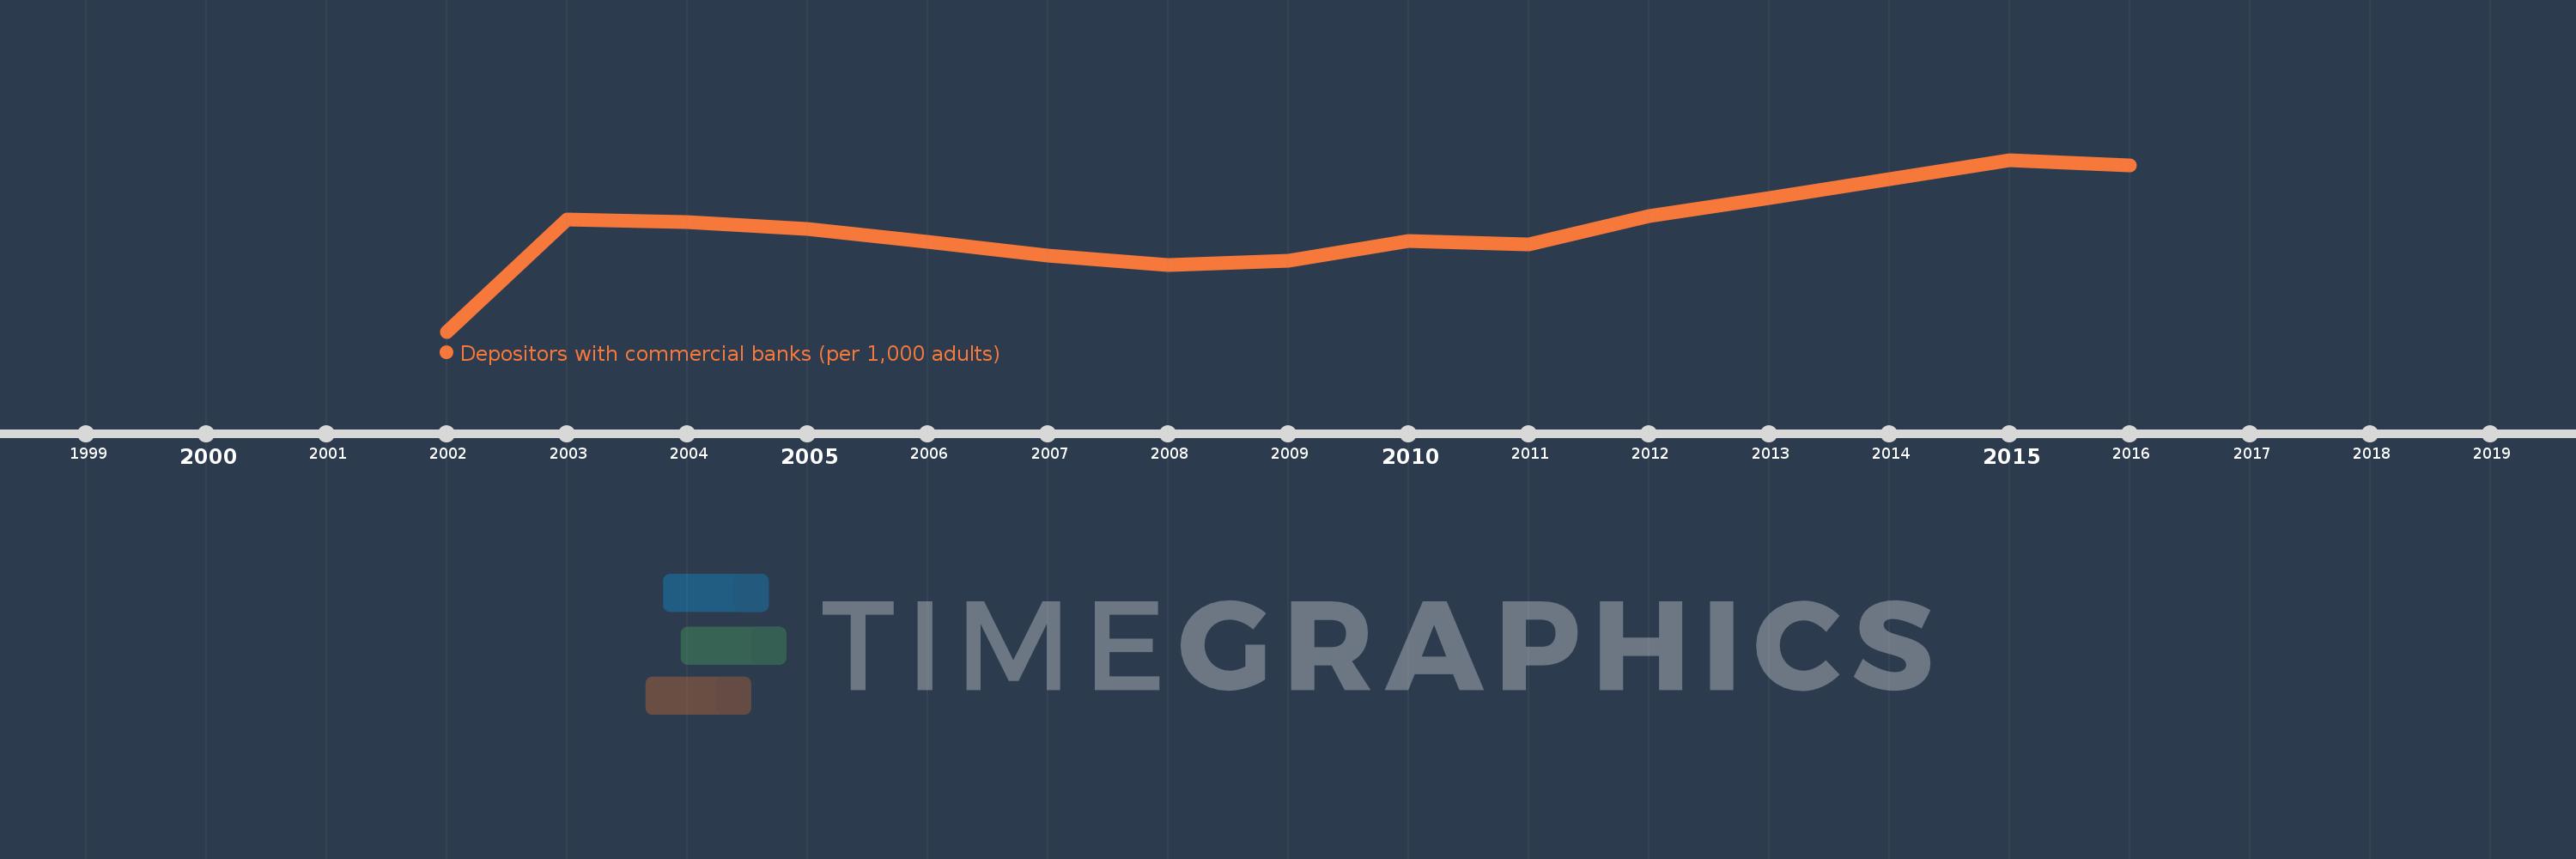
Depositors with commercial banks (per 1,000 adults)
2016,2015,2014,2013,2012,2011,2010,2009,2008,2007,2006,2005,2004,2003,2002
Estas estatísticas em outros países:
Linha do tempo:
Nesta escala de tempo está apresentado um gráfico de 2002 ano até 2016 ano Comoros. Dados de 2001 ano ausente. O número de observações reais por data: 15.
Fonte (nome):
Indicadores de desenvolvimento mundial
Fonte (organização):
International Monetary Fund, Financial Access Survey.
Categorias:
Financial Sector
Foi atualizado:
23 abr 2017 ano
Indicadores de alterações dos valores ao longo dos anos
Máximo:
118.169
1 jan 2015 ano
Na data de observação
Valor
Mudança absoluta
A alteração em relação ao valor anterior
1 jan 2002 ano
0.0
0.0
0.0%
1 jan 2003 ano
76.971
+76.971
%
1 jan 2004 ano
75.288
-1.683
-2.19%
1 jan 2005 ano
70.782
-4.505
-5.98%
1 jan 2006 ano
61.495
-9.287
-13.12%
1 jan 2007 ano
52.269
-9.226
-15.0%
1 jan 2008 ano
45.502
-6.768
-12.95%
1 jan 2009 ano
48.788
+3.286
7.22%
1 jan 2010 ano
62.045
+13.257
27.17%
1 jan 2011 ano
60.106
-1.939
-3.13%
1 jan 2012 ano
79.402
+19.297
32.1%
1 jan 2013 ano
92.021
+12.618
15.89%
1 jan 2014 ano
104.912
+12.892
14.01%
1 jan 2015 ano
118.169
+13.257
12.64%
1 jan 2016 ano
114.589
-3.58
-3.03%
Classificação de países por estatísticas atuais por anos


Comentários: