29
/pt/
pt
AIzaSyAYiBZKx7MnpbEhh9jyipgxe19OcubqV5w
April 1, 2024
230891
Rwanda
RWA
true
2
1
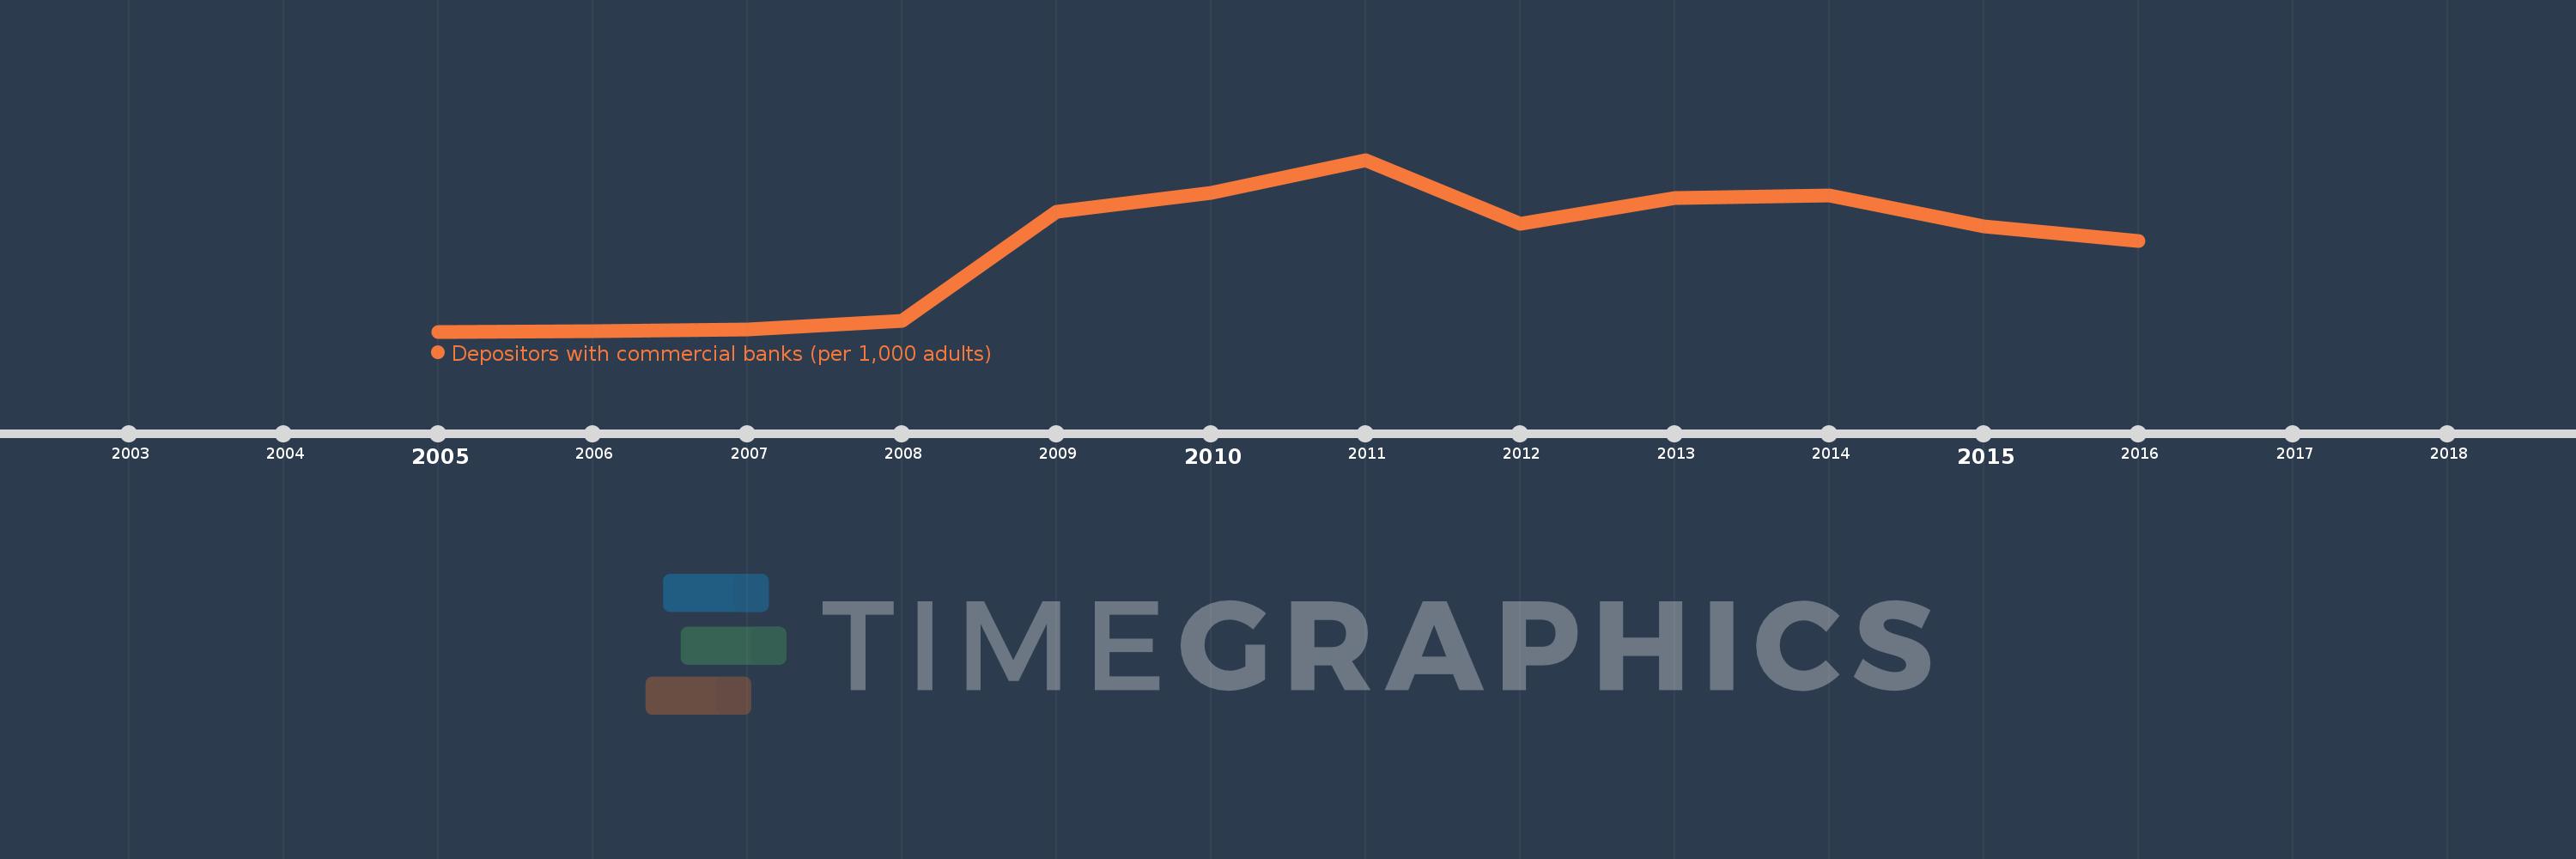
Depositors with commercial banks (per 1,000 adults)
2016,2015,2014,2013,2012,2011,2010,2009,2008,2007,2006,2005
Estas estatísticas em outros países:
Linha do tempo:
Nesta escala de tempo está apresentado um gráfico de 2005 ano até 2016 ano Rwanda. Dados de 2004 ano ausente. O número de observações reais por data: 12.
Fonte (nome):
Indicadores de desenvolvimento mundial
Fonte (organização):
International Monetary Fund, Financial Access Survey.
Categorias:
Financial Sector
Foi atualizado:
23 abr 2017 ano
Indicadores de alterações dos valores ao longo dos anos
Mínimo:
7.455
1 jan 2005 ano
Máximo:
269.605
1 jan 2011 ano
Na data de observação
Valor
Mudança absoluta
A alteração em relação ao valor anterior
1 jan 2005 ano
7.455
+7.455
0.0%
1 jan 2006 ano
8.752
+1.296
17.39%
1 jan 2007 ano
10.504
+1.752
20.02%
1 jan 2008 ano
23.861
+13.357
127.17%
1 jan 2009 ano
189.853
+165.992
695.66%
1 jan 2010 ano
218.605
+28.752
15.14%
1 jan 2011 ano
269.605
+51.0
23.33%
1 jan 2012 ano
171.861
-97.744
-36.25%
1 jan 2013 ano
211.139
+39.278
22.85%
1 jan 2014 ano
214.623
+3.484
1.65%
1 jan 2015 ano
167.717
-46.906
-21.86%
1 jan 2016 ano
146.083
-21.635
-12.9%
Classificação de países por estatísticas atuais por anos


Comentários: