29
/pt/
pt
AIzaSyAYiBZKx7MnpbEhh9jyipgxe19OcubqV5w
April 1, 2024
48026
Middle East & North Africa
MEA
false
2
1
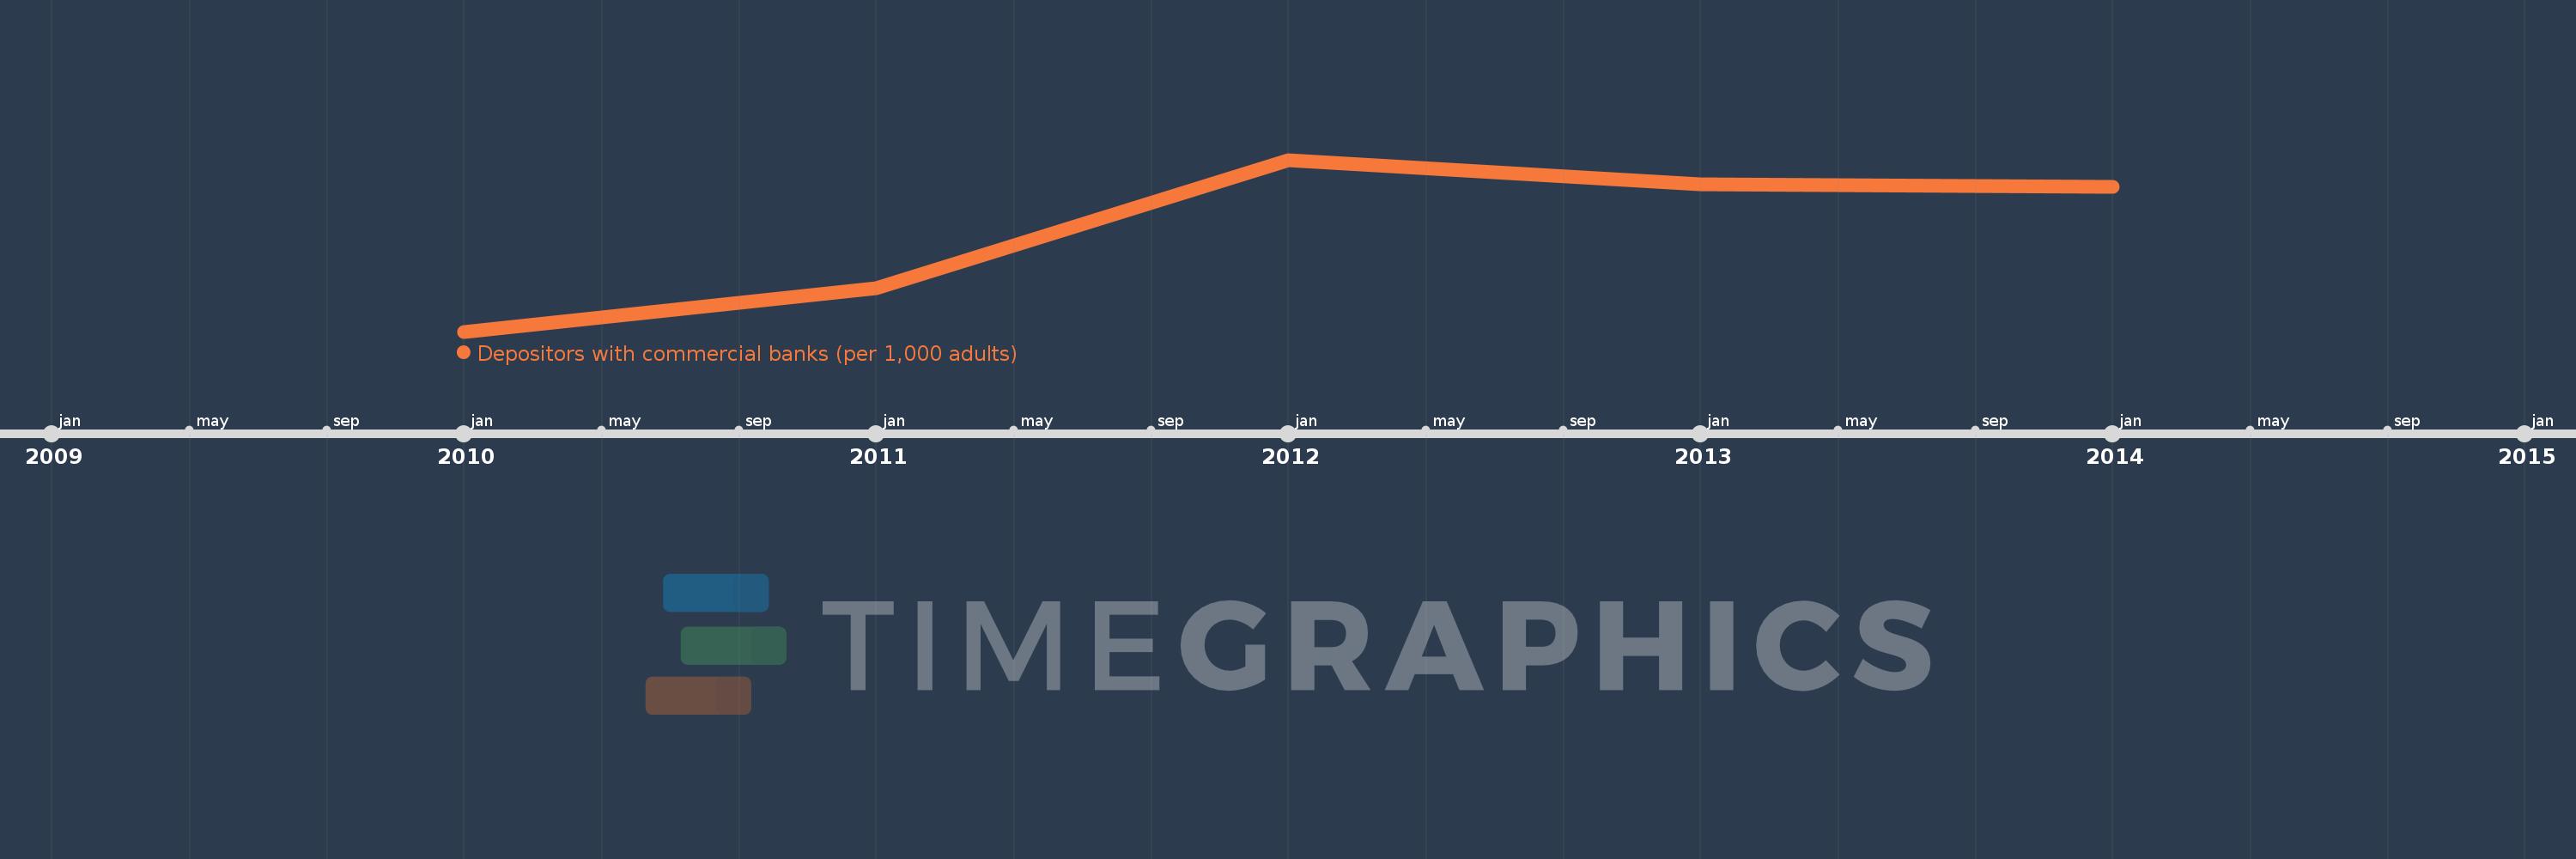
Depositors with commercial banks (per 1,000 adults)
2014,2013,2012,2011,2010
Estas estatísticas em outros países:
Linha do tempo:
Nesta escala de tempo está apresentado um gráfico de 2010 ano até 2014 ano Middle East & North Africa. Dados de 2009 ano ausente. O número de observações reais por data: 5.
Fonte (nome):
Indicadores de desenvolvimento mundial
Fonte (organização):
International Monetary Fund, Financial Access Survey.
Categorias:
Financial Sector
Foi atualizado:
23 abr 2017 ano
Indicadores de alterações dos valores ao longo dos anos
Mínimo:
656.853
1 jan 2010 ano
Máximo:
710.42
1 jan 2012 ano
Na data de observação
Valor
Mudança absoluta
A alteração em relação ao valor anterior
1 jan 2010 ano
656.853
+656.853
0.0%
1 jan 2011 ano
670.46
+13.607
2.07%
1 jan 2012 ano
710.42
+39.96
5.96%
1 jan 2013 ano
702.664
-7.755
-1.09%
1 jan 2014 ano
701.897
-0.767
-0.11%
Classificação de países por estatísticas atuais por anos


Comentários: